
Page 113 - Chemical equilibria Volume 4
P. 113
T (°C)
1400 Molecular Chemical Equilibria 89
1000
600
200
x CO
0 0.2 0.4 0.6 0.8 1
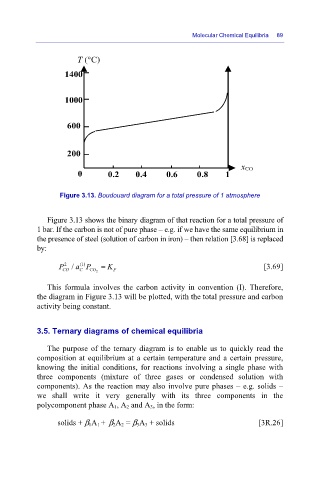
Figure 3.13. Boudouard diagram for a total pressure of 1 atmosphere
Figure 3.13 shows the binary diagram of that reaction for a total pressure of
1 bar. If the carbon is not of pure phase – e.g. if we have the same equilibrium in
the presence of steel (solution of carbon in iron) – then relation [3.68] is replaced
by:
(I)
2
P CO / aP CO 2 = K P [3.69]
C
This formula involves the carbon activity in convention (I). Therefore,
the diagram in Figure 3.13 will be plotted, with the total pressure and carbon
activity being constant.
3.5. Ternary diagrams of chemical equilibria
The purpose of the ternary diagram is to enable us to quickly read the
composition at equilibrium at a certain temperature and a certain pressure,
knowing the initial conditions, for reactions involving a single phase with
three components (mixture of three gases or condensed solution with
components). As the reaction may also involve pure phases – e.g. solids –
we shall write it very generally with its three components in the
polycomponent phase A 1, A 2 and A 3, in the form:
solids + β 1A 1 + β 2A 2 = β 3A 3 + solids [3R.26]