
Page 125 - Chemical equilibria Volume 4
P. 125
y Y Molecular Chemical Equilibria 101
C B
K=4.038
P
K=1
K=0.322 (1600°)
O A x
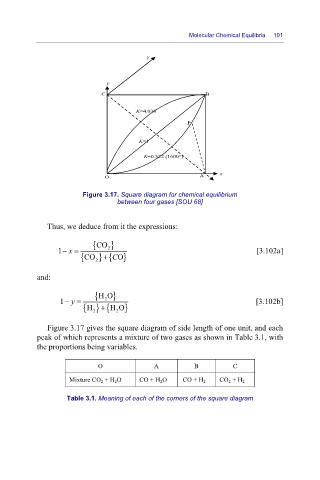
Figure 3.17. Square diagram for chemical equilibrium
between four gases [SOU 68]
Thus, we deduce from it the expressions:
{CO }
1 x−= 2 [3.102a]
+
{CO 2 } { O }
C
and:
{HO }
1 y−= 2 [3.102b]
+
{ } {H O }
H
2
2
Figure 3.17 gives the square diagram of side length of one unit, and each
peak of which represents a mixture of two gases as shown in Table 3.1, with
the proportions being variables.
O A B C
Mixture CO 2 + H 2 O CO + H 2 O CO + H 2 CO 2 + H 2
Table 3.1. Meaning of each of the corners of the square diagram