
Page 454 - Civil Engineering Formulas
P. 454
380 CHAPTER THIRTEEN
Control signal
Water Chlorinator
effluent Chlorine gas
Injector Rotometer
Flow meter
Chlorine solution
Chlorine Compressed
contact gas storage
channel Chlorine residual Control
analyzer signal
Receiving water or reuse
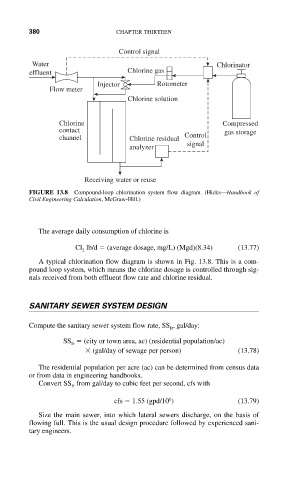
FIGURE 13.8 Compound-loop chlorination system flow diagram. (Hicks—Handbook of
Civil Engineering Calculation, McGraw-Hill.)
The average daily consumption of chlorine is
Cl lb/d (average dosage, mg/L) (Mgd)(8.34) (13.77)
2
A typical chlorination flow diagram is shown in Fig. 13.8. This is a com-
pound loop system, which means the chlorine dosage is controlled through sig-
nals received from both effluent flow rate and chlorine residual.
SANITARY SEWER SYSTEM DESIGN
Compute the sanitary sewer system flow rate, SS , gal/day:
fr
SS (city or town area, ac) (residential population/ac)
fr
(gal/day of sewage per person) (13.78)
The residential population per acre (ac) can be determined from census data
or from data in engineering handbooks.
Convert SS from gal/day to cubic feet per second, cfs with
fr
6
cfs 1.55 (gpd/10 ) (13.79)
Size the main sewer, into which lateral sewers discharge, on the basis of
flowing full. This is the usual design procedure followed by experienced sani-
tary engineers.