Page 85 - Classification Parameter Estimation & State Estimation An Engg Approach Using MATLAB
P. 85

74                                       PARAMETER ESTIMATION

            (a)                           (b)

            320
              z
                                           ||ε||
            315                              2
                                          100
            310
                                           80
            305                            60
                                                                          0.6
                                           40                          0.5
            300
                   observed                  4                       0.4
                   fitted                      4.5
                                           y (mm)   5
            295                             0         5.5         0.3
               0    2    4   6    8   10                   6   0.2  D (mm)
                                  y (mm)
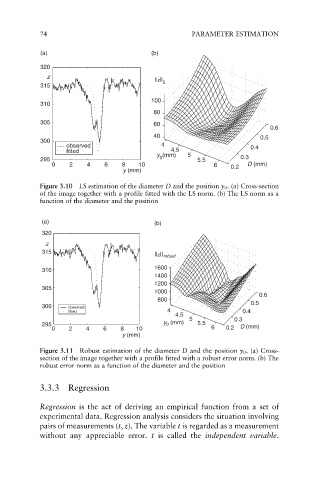
            Figure 3.10  LS estimation of the diameter D and the position y 0 . (a) Cross-section
            of the image together with a profile fitted with the LS norm. (b) The LS norm as a
            function of the diameter and the position


            (a)                            (b)
            320
             z
            315
                                           ||ε|| robust
            310                            1600
                                           1400
                                           1200
            305
                                           1000
                                                                       0.6
                                            800
            300     observed                                         0.5
                    fitted                    4                    0.4
                                                4.5
                                                    5           0.3
            295                              y 0  (mm)  5.5
               0    2   4    6    8   10                  6   0.2  D (mm)
                                  y (mm)
            Figure 3.11 Robust estimation of the diameter D and the position y 0 . (a) Cross-
            section of the image together with a profile fitted with a robust error norm. (b) The
            robust error norm as a function of the diameter and the position

            3.3.3  Regression

            Regression is the act of deriving an empirical function from a set of
            experimental data. Regression analysis considers the situation involving
            pairs of measurements (t, z). The variable t is regarded as a measurement
            without any appreciable error. t is called the independent variable.
   80   81   82   83   84   85   86   87   88   89   90