
Page 377 - Compression Machinery for Oil and Gas
P. 377
358 SECTION II Types of Equipment
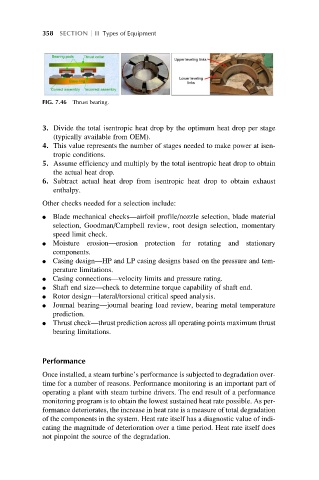
FIG. 7.46 Thrust bearing.
3. Divide the total isentropic heat drop by the optimum heat drop per stage
(typically available from OEM).
4. This value represents the number of stages needed to make power at isen-
tropic conditions.
5. Assume efficiency and multiply by the total isentropic heat drop to obtain
the actual heat drop.
6. Subtract actual heat drop from isentropic heat drop to obtain exhaust
enthalpy.
Other checks needed for a selection include:
l Blade mechanical checks—airfoil profile/nozzle selection, blade material
selection, Goodman/Campbell review, root design selection, momentary
speed limit check.
l Moisture erosion—erosion protection for rotating and stationary
components.
l Casing design—HP and LP casing designs based on the pressure and tem-
perature limitations.
l Casing connections—velocity limits and pressure rating.
l Shaft end size—check to determine torque capability of shaft end.
l Rotor design—lateral/torsional critical speed analysis.
l Journal bearing—journal bearing load review, bearing metal temperature
prediction.
l Thrust check—thrust prediction across all operating points maximum thrust
bearing limitations.
Performance
Once installed, a steam turbine’s performance is subjected to degradation over-
time for a number of reasons. Performance monitoring is an important part of
operating a plant with steam turbine drivers. The end result of a performance
monitoring program is to obtain the lowest sustained heat rate possible. As per-
formance deteriorates, the increase in heat rate is a measure of total degradation
of the components in the system. Heat rate itself has a diagnostic value of indi-
cating the magnitude of deterioration over a time period. Heat rate itself does
not pinpoint the source of the degradation.