
Page 142 - Computational Colour Science Using MATLAB
P. 142
DEVICE-INDEPENDENT REPRESENTATION 129
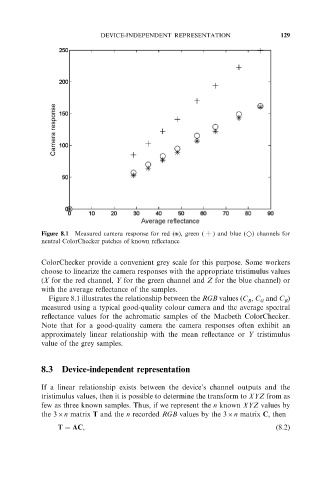
Figure 8.1 Measured camera response for red ( ), green ( ) and blue (*) channels for
neutral ColorChecker patches of known reflectance
ColorChecker provide a convenient grey scale for this purpose. Some workers
choose to linearize the camera responses with the appropriate tristimulus values
(X for the red channel, Y for the green channel and Z for the blue channel) or
with the average reflectance of the samples.
Figure 8.1 illustrates the relationship between the RGB values (C , C and C )
B
G
R
measured using a typical good-quality colour camera and the average spectral
reflectance values for the achromatic samples of the Macbeth ColorChecker.
Note that for a good-quality camera the camera responses often exhibit an
approximately linear relationship with the mean reflectance or Y tristimulus
value of the grey samples.
8.3 Device-independent representation
If a linear relationship exists between the device’s channel outputs and the
tristimulus values, then it is possible to determine the transform to XYZ from as
few as three known samples. Thus, if we represent the n known XYZ values by
the 36n matrix T and the n recorded RGB values by the 36n matrix C, then
T ¼ AC, ð8:2Þ