
Page 144 - Computational Colour Science Using MATLAB
P. 144
IMPLEMENTATIONS AND EXAMPLES 131
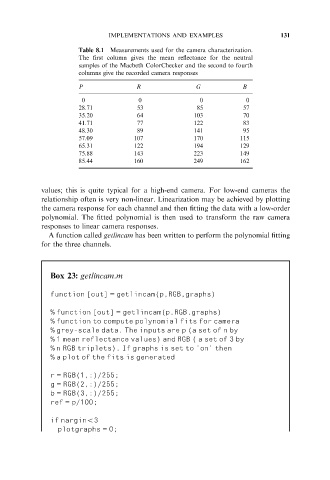
Table 8.1 Measurements used for the camera characterization.
The first column gives the mean reflectance for the neutral
samples of the Macbeth ColorChecker and the second to fourth
columns give the recorded camera responses
P R G B
0 0 0 0
28.71 53 85 57
35.20 64 103 70
41.71 77 122 83
48.30 89 141 95
57.09 107 170 115
65.31 122 194 129
75.88 143 223 149
85.44 160 249 162
values; this is quite typical for a high-end camera. For low-end cameras the
relationship often is very non-linear. Linearization may be achieved by plotting
the camera response for each channel and then fitting the data with a low-order
polynomial. The fitted polynomial is then used to transform the raw camera
responses to linear camera responses.
A function called getlincam has been written to perform the polynomial fitting
for the three channels.
Box 23: getlincam.m
function [out] = getlincam(p,RGB,graphs)
% function [out] = getlincam(p,RGB,graphs)
% function to compute polynomial fits for camera
% grey-scale data. The inputs are p (a set of n by
% 1 mean reflectance values) and RGB ( a set of 3 by
% n RGB triplets). If graphs is set to ’on’ then
% a plot of the fits is generated
r = RGB(1,:)/255;
g = RGB(2,:)/255;
b = RGB(3,:)/255;
ref = p/100;
if nargin53
plotgraphs = 0;