
Page 164 - Computational Colour Science Using MATLAB
P. 164
IMPLEMENTATIONS AND EXAMPLES 151
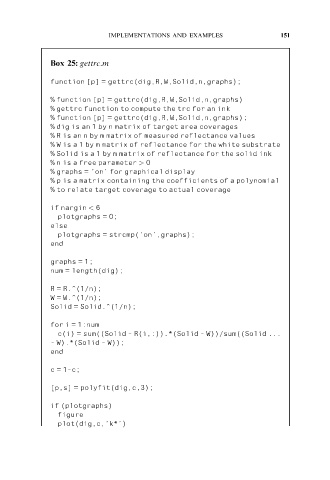
Box 25: gettrc.m
function [p] = gettrc(dig,R,W,Solid,n,graphs);
% function [p] = gettrc(dig,R,W,Solid,n,graphs)
% gettrc function to compute the trc for an ink
% function [p] = gettrc(dig,R,W,Solid,n,graphs);
% dig is an 1 by n matrix of target area coverages
% R is an n by m matrix of measured reflectance values
% W is a 1 by m matrix of reflectance for the white substrate
% Solid is a 1 by m matrix of reflectance for the solid ink
% n is a free parameter > 0
% graphs = ’on’ for graphical display
% p is a matrix containing the coefficients of a polynomial
% to relate target coverage to actual coverage
if nargin < 6
plotgraphs = 0;
else
plotgraphs = strcmp(’on’,graphs);
end
graphs = 1;
num = length(dig);
R = R.^(1/n);
W = W.^(1/n);
Solid = Solid.^(1/n);
for i = 1:num
c(i) = sum((Solid - R(i,:)).*(Solid - W))/sum((Solid ...
- W).*(Solid - W));
end
c = 1-c;
[p,s] = polyfit(dig,c,3);
if (plotgraphs)
figure
plot(dig,c,’k*’)