
Page 169 - Computational Colour Science Using MATLAB
P. 169
156 CHARACTERIZATION OF PRINTERS
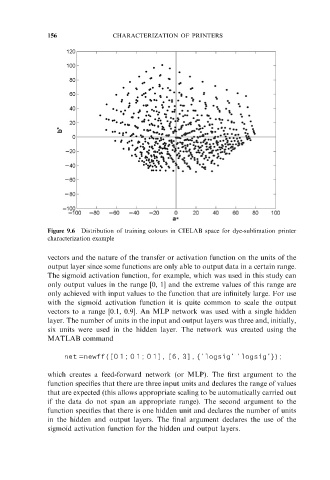
Figure 9.6 Distribution of training colours in CIELAB space for dye-sublimation printer
characterization example
vectors and the nature of the transfer or activation function on the units of the
output layer since some functions are only able to output data in a certain range.
The sigmoid activation function, for example, which was used in this study can
only output values in the range [0, 1] and the extreme values of this range are
only achieved with input values to the function that are infinitely large. For use
with the sigmoid activation function it is quite common to scale the output
vectors to a range [0.1, 0.9]. An MLP network was used with a single hidden
layer. The number of units in the input and output layers was three and, initially,
six units were used in the hidden layer. The network was created using the
MATLAB command
net =newff([0 1; 0 1; 0 1], [6, 3], {’logsig’ ’logsig’});
which creates a feed-forward network (or MLP). The first argument to the
function specifies that there are three input units and declares the range of values
that are expected (this allows appropriate scaling to be automatically carried out
if the data do not span an appropriate range). The second argument to the
function specifies that there is one hidden unit and declares the number of units
in the hidden and output layers. The final argument declares the use of the
sigmoid activation function for the hidden and output layers.