
Page 59 - Computational Colour Science Using MATLAB
P. 59
46 COMPUTING CIE TRISTIMULUS VALUES
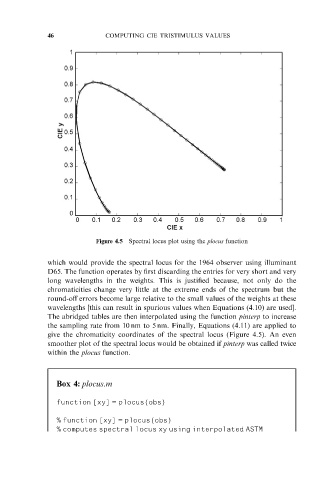
Figure 4.5 Spectral locus plot using the plocus function
which would provide the spectral locus for the 1964 observer using illuminant
D65. The function operates by first discarding the entries for very short and very
long wavelengths in the weights. This is justified because, not only do the
chromaticities change very little at the extreme ends of the spectrum but the
round-off errors become large relative to the small values of the weights at these
wavelengths [this can result in spurious values when Equations (4.10) are used].
The abridged tables are then interpolated using the function pinterp to increase
the sampling rate from 10 nm to 5 nm. Finally, Equations (4.11) are applied to
give the chromaticity coordinates of the spectral locus (Figure 4.5). An even
smoother plot of the spectral locus would be obtained if pinterp was called twice
within the plocus function.
Box 4: plocus.m
function [xy] = plocus(obs)
% function [xy] = plocus(obs)
% computes spectral locus xy using interpolated ASTM