
Page 54 - Computational Colour Science Using MATLAB
P. 54
IMPLEMENTATIONS AND EXAMPLES 41
s(i*2) = temp(i);
end
s((N-1)*2 + 1) = p(N);
The format for this function is
[s] = pinterp(p)
where p is an n61or16n matrix. The function pinterp includes a special
MATLAB operator called ones that simply creates an array of 1s that will form
the rightmost column of the Vandermonde matrix [see Equation (4.5)]. Table 4.1
illustrates the performance of the pinterp function.
4.8.3 Computing tristimulus values
The function r2xyz computes XYZ tristimulus values using ASTM Table 5
colour-matching functions from the ASTM standard (ASTM, 2001). The
reflectance data should be in the range [0, 1] rather than in per cent format and
must be sampled at 10-nm intervals. Since ASTM Table 5 is used it is assumed
that the reflectance data have been corrected for the spectral bandpass properties
of the spectrophotometer that was used for their measurement. A typical call for
a reflectance spectrum sampled at 10-nm intervals in the range 400–700 nm
would be
[xyz] = r2xyz(p,400,700,’d65___64’);
where p represents a 3161 matrix. The second and third arguments relate to the
shortest and longest wavelengths available in the reflectance data. The fourth
argument specifies the illuminant and observer combination to be used.
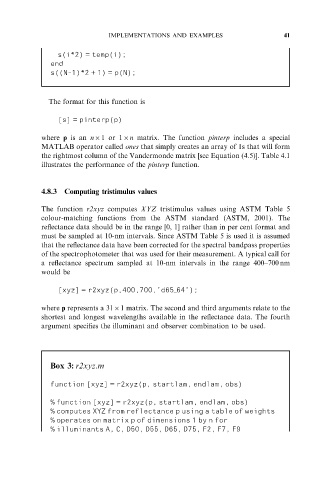
Box 3: r2xyz.m
function [xyz] = r2xyz(p, startlam, endlam, obs)
% function [xyz] = r2xyz(p, startlam, endlam, obs)
% computes XYZ from reflectance p using a table of weights
% operates on matrix p of dimensions 1 by n for
% illuminants A, C, D50, D55, D65, D75, F2, F7, F9