
Page 50 - Computational Colour Science Using MATLAB
P. 50
IMPLEMENTATIONS AND EXAMPLES 37
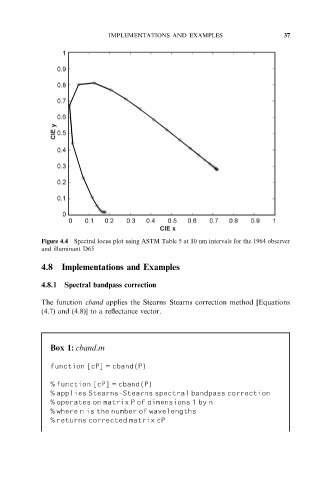
Figure 4.4 Spectral locus plot using ASTM Table 5 at 10 nm intervals for the 1964 observer
and illuminant D65
4.8 Implementations and Examples
4.8.1 Spectral bandpass correction
The function cband applies the Stearns–Stearns correction method [Equations
(4.7) and (4.8)] to a reflectance vector.
Box 1: cband.m
function [cP] = cband(P)
% function [cP] = cband(P)
% applies Stearns-Stearns spectral bandpass correction
% operates on matrix P of dimensions 1 by n
% where n is the number of wavelengths
% returns corrected matrix cP