
Page 49 - Computational Colour Science Using MATLAB
P. 49
36 COMPUTING CIE TRISTIMULUS VALUES
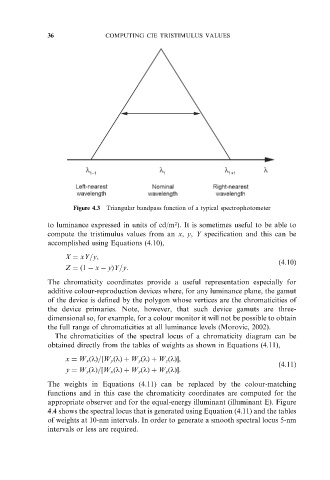
Figure 4.3 Triangular bandpass function of a typical spectrophotometer
2
to luminance expressed in units of cd/m ). It is sometimes useful to be able to
compute the tristimulus values from an x, y, Y specification and this can be
accomplished using Equations (4.10),
X ¼ xY=y,
Z ¼ð1 x yÞY=y. ð4:10Þ
The chromaticity coordinates provide a useful representation especially for
additive colour-reproduction devices where, for any luminance plane, the gamut
of the device is defined by the polygon whose vertices are the chromaticities of
the device primaries. Note, however, that such device gamuts are three-
dimensional so, for example, for a colour monitor it will not be possible to obtain
the full range of chromaticities at all luminance levels (Morovic, 2002).
The chromaticities of the spectral locus of a chromaticity diagram can be
obtained directly from the tables of weights as shown in Equations (4.11),
x ¼ W x ðlÞ=½W y ðlÞþ W y ðlÞþ W z ðlÞ,
ð4:11Þ
y ¼ W y ðlÞ=½W x ðlÞþ W y ðlÞþ W z ðlÞ.
The weights in Equations (4.11) can be replaced by the colour-matching
functions and in this case the chromaticity coordinates are computed for the
appropriate observer and for the equal-energy illuminant (illuminant E). Figure
4.4 shows the spectral locus that is generated using Equation (4.11) and the tables
of weights at 10-nm intervals. In order to generate a smooth spectral locus 5-nm
intervals or less are required.