
Page 276 - Computational Modeling in Biomedical Engineering and Medical Physics
P. 276
Hyperthermia and ablation 265
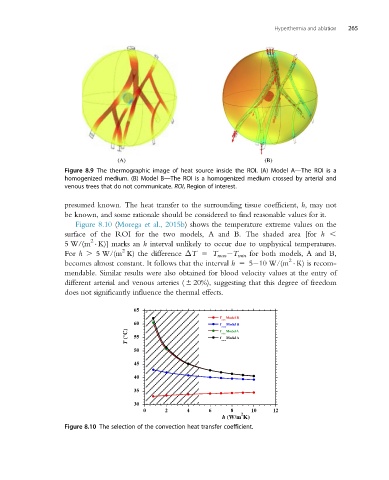
Figure 8.9 The thermographic image of heat source inside the ROI. (A) Model A—The ROI is a
homogenized medium. (B) Model B—The ROI is a homogenized medium crossed by arterial and
venous trees that do not communicate. ROI, Region of interest.
presumed known. The heat transfer to the surrounding tissue coefficient, h, may not
be known, and some rationale should be considered to find reasonable values for it.
Figure 8.10 (Morega et al., 2015b) shows the temperature extreme values on the
surface of the ROI for the two models, A and B. The shaded area [for h ,
2
5 W/(m K)] marks an h interval unlikely to occur due to unphysical temperatures.
2
For h . 5 W/(m K) the difference ΔT 5 T max T min for both models, A and B,
2
becomes almost constant. It follows that the interval h 5 5 10 W/(m K) is recom-
mendable. Similar results were also obtained for blood velocity values at the entry of
different arterial and venous arteries ( 6 20%), suggesting that this degree of freedom
does not significantly influence the thermal effects.
Figure 8.10 The selection of the convection heat transfer coefficient.