
Page 104 - Computational Retinal Image Analysis
P. 104
(A) (B)
(C) (D)
(E) (F)
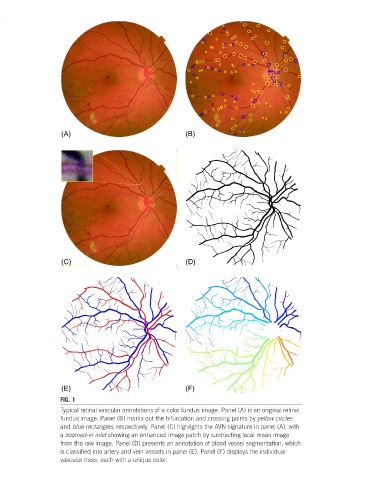
FIG. 1
Typical retinal vascular annotations of a color fundus image. Panel (A) is an original retinal
fundus image. Panel (B) marks out the bifurcation and crossing points by yellow circles
and blue rectangles, respectively. Panel (C) highlights the AVN signature in panel (A), with
a zoomed-in inlet showing an enhanced image patch by subtracting local mean image
from the raw image. Panel (D) presents an annotation of blood vessel segmentation, which
is classified into artery and vein vessels in panel (E). Panel (F) displays the individual
vascular trees, each with a unique color.