
Page 149 - Computational Retinal Image Analysis
P. 149
2 Automated image quality assessment algorithms 143
reliable diagnosis to be made, otherwise the images were judged as inadequate.
Mahapatra et al. [40] used a dataset acquired from a DR screening initiative. All
images were assessed by human graders to confirm if they were suitable for grading.
The dataset (D1) consisted of 9653 ungradable retinal images and 11,347 gradable
images. Sun et al. [41] used an open source dataset to evaluate the method from the
Kaggle coding website [46]. 2894 images and 2170 images as the training set and test
set respectively were randomly selected from the 80,000 images available. All the
images were tagged by experts regarding the quality of the image in terms of being
gradable or not. Abdel-Hamid et al. [39] applied four different retinal image quality
assessment algorithms to images originating from four different public datasets:
HRF [47], DRIMDB [48], DR2 [49], Messidor [17]. Giancardo et al. [23] made use
of datasets that included 10,862 images from a Netherlands study [50]. Access to
public image datasets and their accompanying clinical grades are increasing year-on-
year. With on-line competitions, such as Kaggle [46], where researchers can compare
algorithm performance using access to public training sets, the importance of IQA
algorithms is key to enabling reliable and consistent retinal image analysis systems
to be developed.
As we have seen, IQA algorithm development is dependent upon the clinical
application being used. In order to evaluate an automated algorithm, it must be judged
against a ground truth. The ground truth is a classification of an image that has been
made by a human observer, who is usually an expert within the field. When IQA
algorithms are evaluated, each image contained within a test set is normally classified
by experts into two classes that reflect the quality of an image as either “adequate” or
“inadequate”. If an image is labeled as inadequate, then the image quality is too poor
for the clinical objectives for which the image has been taken to be achieved. Given
two ground truth classifications of adequate or inadequate, four outcomes are possible
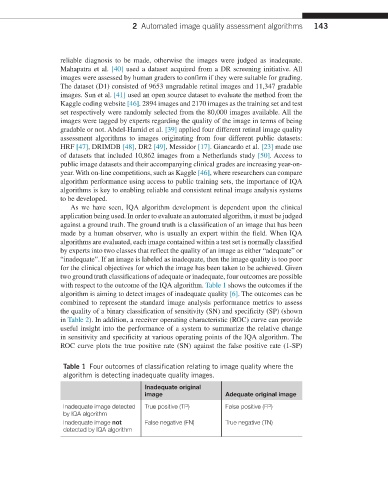
with respect to the outcome of the IQA algorithm. Table 1 shows the outcomes if the
algorithm is aiming to detect images of inadequate quality [6]. The outcomes can be
combined to represent the standard image analysis performance metrics to assess
the quality of a binary classification of sensitivity (SN) and specificity (SP) (shown
in Table 2). In addition, a receiver operating characteristic (ROC) curve can provide
useful insight into the performance of a system to summarize the relative change
in sensitivity and specificity at various operating points of the IQA algorithm. The
ROC curve plots the true positive rate (SN) against the false positive rate (1-SP)
Table 1 Four outcomes of classification relating to image quality where the
algorithm is detecting inadequate quality images.
Inadequate original
image Adequate original image
Inadequate image detected True positive (TP) False positive (FP)
by IQA algorithm
Inadequate image not False negative (FN) True negative (TN)
detected by IQA algorithm