
Page 150 - Computational Retinal Image Analysis
P. 150
144 CHAPTER 8 Image quality assessment
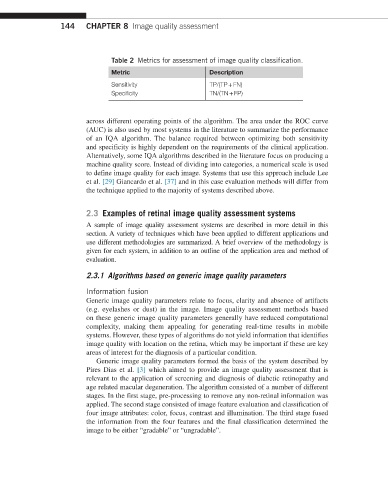
Table 2 Metrics for assessment of image quality classification.
Metric Description
Sensitivity TP/(TP + FN)
Specificity TN/(TN + FP)
across different operating points of the algorithm. The area under the ROC curve
(AUC) is also used by most systems in the literature to summarize the performance
of an IQA algorithm. The balance required between optimizing both sensitivity
and specificity is highly dependent on the requirements of the clinical application.
Alternatively, some IQA algorithms described in the literature focus on producing a
machine quality score. Instead of dividing into categories, a numerical scale is used
to define image quality for each image. Systems that use this approach include Lee
et al. [29] Giancardo et al. [37] and in this case evaluation methods will differ from
the technique applied to the majority of systems described above.
2.3 Examples of retinal image quality assessment systems
A sample of image quality assessment systems are described in more detail in this
section. A variety of techniques which have been applied to different applications and
use different methodologies are summarized. A brief overview of the methodology is
given for each system, in addition to an outline of the application area and method of
evaluation.
2.3.1 Algorithms based on generic image quality parameters
Information fusion
Generic image quality parameters relate to focus, clarity and absence of artifacts
(e.g. eyelashes or dust) in the image. Image quality assessment methods based
on these generic image quality parameters generally have reduced computational
complexity, making them appealing for generating real-time results in mobile
systems. However, these types of algorithms do not yield information that identifies
image quality with location on the retina, which may be important if these are key
areas of interest for the diagnosis of a particular condition.
Generic image quality parameters formed the basis of the system described by
Pires Dias et al. [3] which aimed to provide an image quality assessment that is
relevant to the application of screening and diagnosis of diabetic retinopathy and
age related macular degeneration. The algorithm consisted of a number of different
stages. In the first stage, pre-processing to remove any non-retinal information was
applied. The second stage consisted of image feature evaluation and classification of
four image attributes: color, focus, contrast and illumination. The third stage fused
the information from the four features and the final classification determined the
image to be either “gradable” or “ungradable”.