
Page 154 - Computational Retinal Image Analysis
P. 154
148 CHAPTER 8 Image quality assessment
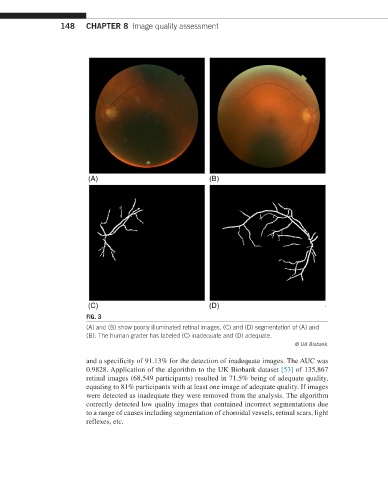
FIG. 3
(A) and (B) show poorly illuminated retinal images, (C) and (D) segmentation of (A) and
(B). The human grader has labeled (C) inadequate and (D) adequate.
© UK Biobank.
and a specificity of 91.13% for the detection of inadequate images. The AUC was
0.9828. Application of the algorithm to the UK Biobank dataset [53] of 135,867
retinal images (68,549 participants) resulted in 71.5% being of adequate quality,
equating to 81% participants with at least one image of adequate quality. If images
were detected as inadequate they were removed from the analysis. The algorithm
correctly detected low quality images that contained incorrect segmentations due
to a range of causes including segmentation of choroidal vessels, retinal scars, light
reflexes, etc.