
Page 208 - Computational Statistics Handbook with MATLAB
P. 208
Chapter 6: Monte Carlo Methods for Inferential Statistics 195
the upper tail or both tails, and which one is appropriate depends on the
alternative hypothesis. For example:
• If a large value of the test statistic would provide evidence for the
alternative hypothesis, then the critical region is in the upper tail
of the distribution of the test statistic. This is sometimes referred
to as an upper tail test.
• If a small value of the test statistic provides evidence for the alter-
native hypothesis, then the critical region is in the lower tail of the
distribution of the test statistic. This is sometimes referred to as a
lower tail test.
• If small or large values of the test statistic indicate evidence for the
alternative hypothesis, then the critical region is in the lower and
upper tails. This is sometimes referred to as a two-tail test.
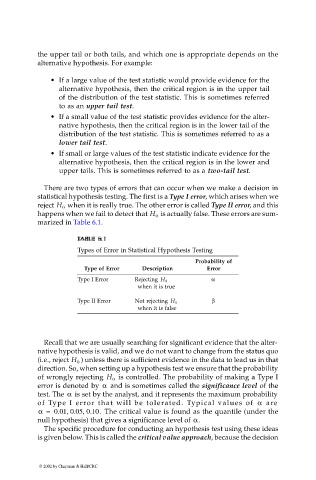
There are two types of errors that can occur when we make a decision in
statistical hypothesis testing. The first is a Type I error, which arises when we
when it is really true. The other error is called Type II error, and this
reject H 0
is actually false. These errors are sum-
happens when we fail to detect that H 0
marized in Table 6.1.
T
A
T
TA
.
E6
E6
1
1
BL
A
B
LE
L
T AB B L 6 E6 .. .1 1
Types of Error in Statistical Hypothesis Testing
Probability of
Type of Error Description Error
Type I Error Rejecting H 0 α
when it is true
Type II Error Not rejecting H 0 β
when it is false
Recall that we are usually searching for significant evidence that the alter-
native hypothesis is valid, and we do not want to change from the status quo
) unless there is sufficient evidence in the data to lead us in that
(i.e., reject H 0
direction. So, when setting up a hypothesis test we ensure that the probability
is controlled. The probability of making a Type I
of wrongly rejecting H 0
error is denoted by α and is sometimes called the significance level of the
α
test. The is set by the analyst, and it represents the maximum probability
of Type I error that will be tolerated. Typical values of α are
,
,
α = 0.01 0.05 0.10. The critical value is found as the quantile (under the
null hypothesis) that gives a significance level of α.
The specific procedure for conducting an hypothesis test using these ideas
is given below. This is called the critical value approach, because the decision
© 2002 by Chapman & Hall/CRC