
Page 212 - Computational Statistics Handbook with MATLAB
P. 212
Chapter 6: Monte Carlo Methods for Inferential Statistics 199
pow = 1 - beta;
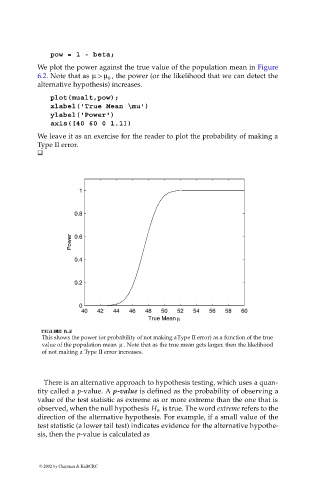
We plot the power against the true value of the population mean in Figure
6.2. Note that as µ > µ 0 , the power (or the likelihood that we can detect the
alternative hypothesis) increases.
plot(mualt,pow);
xlabel('True Mean \mu')
ylabel('Power')
axis([40 60 0 1.1])
We leave it as an exercise for the reader to plot the probability of making a
Type II error.
1
0.8
Power 0.6
0.4
0.2
0
40 42 44 46 48 50 52 54 56 58 60
True Mean µ
IG
FI F U URE G 6. RE 6. 2 2
2
F F II GU RE RE 6. 6. 2
GU
This shows the power (or probability of not making a Type II error) as a function of the true
µ
value of the population mean . Note that as the true mean gets larger, then the likelihood
of not making a Type II error increases.
There is an alternative approach to hypothesis testing, which uses a quan-
tity called a p-value. A p-value is defined as the probability of observing a
value of the test statistic as extreme as or more extreme than the one that is
is true. The word extreme refers to the
observed, when the null hypothesis H 0
direction of the alternative hypothesis. For example, if a small value of the
test statistic (a lower tail test) indicates evidence for the alternative hypothe-
sis, then the p-value is calculated as
© 2002 by Chapman & Hall/CRC