
Page 318 - Computational Statistics Handbook with MATLAB
P. 318
Chapter 8: Probability Density Estimation 307
.6
.5
.4
Mixing Coefficient .3
.2
.1
0
−5 −4 −3 −2 −1 0 1 2 3
Mean
0.35
0.3
0.25
0.2
0.15
0.1
0.05
0
−10 −8 −6 −4 −2 0 2 4 6 8 10
x
U
FI F IG URE G 8.1 RE 8.1 6 6
F F II GU RE RE 8.1 6 6
8.1
GU
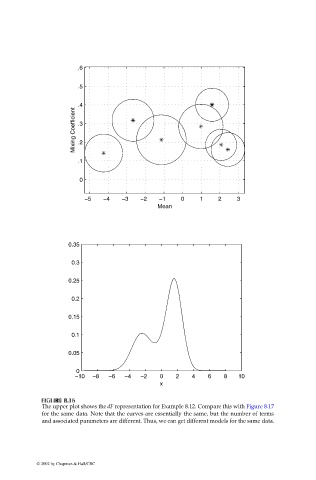
The upper plot shows the dF representation for Example 8.12. Compare this with Figure 8.17
for the same data. Note that the curves are essentially the same, but the number of terms
and associated parameters are different. Thus, we can get different models for the same data.
© 2002 by Chapman & Hall/CRC