
Page 359 - Computational Statistics Handbook with MATLAB
P. 359
348 Computational Statistics Handbook with MATLAB
% This shows how to generate the data that will be used
% to illustrate classification trees.
deln = 25;
data(1:deln,:) = rand(deln,2)+.5;
so=deln+1; sf = 2*deln;
data(so:sf,:) = rand(deln,2)-.5;
so=sf+1; sf = 3*deln;
data(so:sf,1) = rand(deln,1)-.5;
data(so:sf,2) = rand(deln,1)+.5;
so=sf+1; sf = 4*deln;
data(so:sf,1) = rand(deln,1)+.5;
data(so:sf,2) = rand(deln,1)-.5;
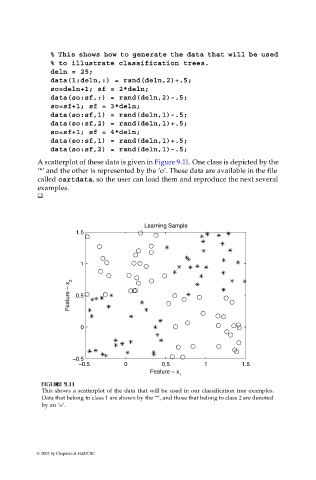
A scatterplot of these data is given in Figure 9.11. One class is depicted by the
‘*’ and the other is represented by the ‘o’. These data are available in the file
called cartdata, so the user can load them and reproduce the next several
examples.
Learning Sample
1.5
1
Feature − x 2 0.5
0
−0.5
−0.5 0 0.5 1 1.5
Feature − x
1
F FI U URE G 9. RE 9. 1 11 1
IG
1
GU
F F II GU RE RE 9. 9. 1 1 1
This shows a scatterplot of the data that will be used in our classification tree examples.
Data that belong to class 1 are shown by the ‘*’, and those that belong to class 2 are denoted
by an ‘o’.
© 2002 by Chapman & Hall/CRC