
Page 362 - Computational Statistics Handbook with MATLAB
P. 362
Chapter 9: Statistical Pattern Recognition 351
load cartdata
% Loads up data.
% Inputs to function - csgrowc.
maxn = 5; % maximum number in terminal nodes
clas = [1 2]; % class labels
pies = [0.5 0.5]; % optional prior probabilities
Nk = [50, 50]; % number in each class
The following MATLAB commands grow the initial tree and plot the results
in Figure 9.12.
tree = csgrowc(X,maxn,clas,Nk,pies);
csplotreec(tree)
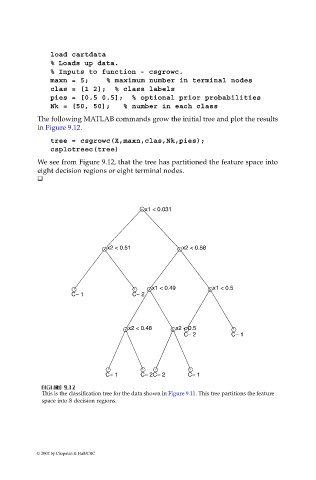
We see from Figure 9.12, that the tree has partitioned the feature space into
eight decision regions or eight terminal nodes.
x1 < 0.031
x2 < 0.51 x2 < 0.58
x1 < 0.49 x1 < 0.5
C− 1 C− 2
x2 < 0.48 x2 < 0.5
C− 2 C− 1
C− 1 C− 2C− 2 C− 1
F FI U URE G 9.1 RE 9.1 2 2
IG
F F II GU RE RE 9.1 2 2
GU
9.1
This is the classification tree for the data shown in Figure 9.11. This tree partitions the feature
space into 8 decision regions.
© 2002 by Chapman & Hall/CRC