
Page 364 - Computational Statistics Handbook with MATLAB
P. 364
Chapter 9: Statistical Pattern Recognition 353
o de N 3
Nod e 5
o de N 4
de No 6 Nod e 7
GU
IG
F FI F F II U URE GU 9.1 RE RE RE 9.1 3 3 3 3
9.1
9.1
G
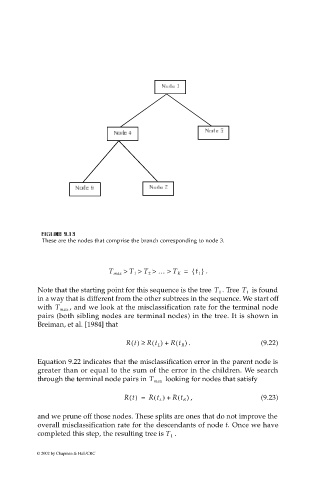
These are the nodes that comprise the branch corresponding to node 3.
T max > T 1 > T 2 > … > T K = {} .
t 1
is found
Note that the starting point for this sequence is the tree T 1 . Tree T 1
in a way that is different from the other subtrees in the sequence. We start off
, and we look at the misclassification rate for the terminal node
with T max
pairs (both sibling nodes are terminal nodes) in the tree. It is shown in
Breiman, et al. [1984] that
Rt() ≥ Rt L + Rt R . (9.22)
()
()
Equation 9.22 indicates that the misclassification error in the parent node is
greater than or equal to the sum of the error in the children. We search
looking for nodes that satisfy
through the terminal node pairs in T max
()
()
Rt() = Rt L + Rt R , (9.23)
and we prune off those nodes. These splits are ones that do not improve the
overall misclassification rate for the descendants of node t. Once we have
.
completed this step, the resulting tree is T 1
© 2002 by Chapman & Hall/CRC