
Page 302 -
P. 302
Section 9.3 Image Segmentation by Clustering Pixels 270
tween the closest elements as the inter-cluster distance, which tends to yield
extended clusters (statisticians call this method single-link clustering). An-
other natural choice is the maximum distance between an element of the first
cluster and one of the second, which tends to yield rounded clusters (statis-
ticians call this method complete-link clustering). Finally, one could use an
average of distances between elements in the cluster, which also tends to yield
“rounded” clusters (statisticians call this method group average clustering).
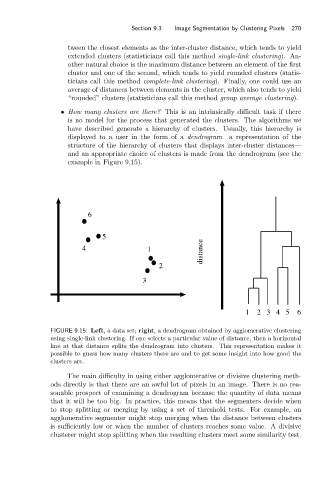
• How many clusters are there? This is an intrinsically difficult task if there
is no model for the process that generated the clusters. The algorithms we
have described generate a hierarchy of clusters. Usually, this hierarchy is
displayed to a user in the form of a dendrogram—a representation of the
structure of the hierarchy of clusters that displays inter-cluster distances—
and an appropriate choice of clusters is made from the dendrogram (see the
example in Figure 9.15).
6
5
distance
4 1
2
3
1 2345 6
FIGURE 9.15: Left, a data set; right, a dendrogram obtained by agglomerative clustering
using single-link clustering. If one selects a particular value of distance, then a horizontal
line at that distance splits the dendrogram into clusters. This representation makes it
possible to guess how many clusters there are and to get some insight into how good the
clusters are.
The main difficulty in using either agglomerative or divisive clustering meth-
ods directly is that there are an awful lot of pixels in an image. There is no rea-
sonable prospect of examining a dendrogram because the quantity of data means
that it will be too big. In practice, this means that the segmenters decide when
to stop splitting or merging by using a set of threshold tests. For example, an
agglomerative segmenter might stop merging when the distance between clusters
is sufficiently low or when the number of clusters reaches some value. A divisive
clusterer might stop splitting when the resulting clusters meet some similarity test.