
Page 336 -
P. 336
Section 10.4 Robustness 304
6 6 6
4 4 4
2 2 2
0 0 0
-2 -2 -2
-4 -4 -4
-6 -6 -6
-8 -8 -8
-10 -10 -10
-12 -12 -12
-14 -14 -14
-14 -12 -10 -8 -6 -4 -2 0 2 4 6 -14 -12 -10 -8 -6 -4 -2 0 2 4 6 -14 -12 -10 -8 -6 -4 -2 0 2 4 6
2 2 2
1.5 1.5 1.5
1 1 1
0.5 0.5 0.5
0 0 0
-0.5 -0.5 -0.5
-1 -1 -1
-1.5 -1.5 -1.5
-2 -2 -2
-2 -1.5 -1 -0.5 0 0.5 1 1.5 2 -2 -1.5 -1 -0.5 0 0.5 1 1.5 2 -2 -1.5 -1 -0.5 0 0.5 1 1.5 2
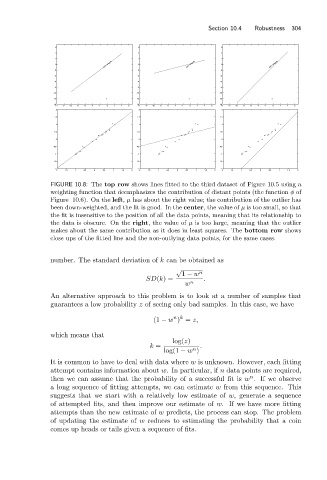
FIGURE 10.8: The top row shows lines fitted to the third dataset of Figure 10.5 using a
weighting function that deemphasizes the contribution of distant points (the function φ of
Figure 10.6). On the left, μ has about the right value; the contribution of the outlier has
been down-weighted, and the fit is good. In the center,the value of μ is too small, so that
the fit is insensitive to the position of all the data points, meaning that its relationship to
the data is obscure. On the right,the value of μ is too large, meaning that the outlier
makes about the same contribution as it does in least squares. The bottom row shows
close ups of the fitted line and the non-outlying data points, for the same cases.
number. The standard deviation of k can be obtained as
√
1 − w n
SD(k)= .
w n
An alternative approach to this problem is to look at a number of samples that
guarantees a low probability z of seeing only bad samples. In this case, we have
n k
(1 − w ) = z,
which means that
log(z)
k = .
n
log(1 − w )
It is common to have to deal with data where w is unknown. However, each fitting
attempt contains information about w. In particular, if n data points are required,
n
then we can assume that the probability of a successful fit is w .If we observe
a long sequence of fitting attempts, we can estimate w from this sequence. This
suggests that we start with a relatively low estimate of w, generate a sequence
of attempted fits, and then improve our estimate of w. If we have more fitting
attempts than the new estimate of w predicts, the process can stop. The problem
of updating the estimate of w reduces to estimating the probability that a coin
comes up heads or tails given a sequence of fits.