
Page 301 - Control Theory in Biomedical Engineering
P. 301
274 Control theory in biomedical engineering
https://doi.org/10.5061/dryad.sk55m. These experimental results include
data of walking on the treadmill for 17 young adults. Each subject was
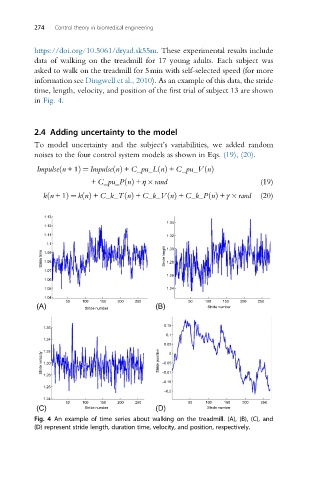
asked to walk on the treadmill for 5min with self-selected speed (for more
information see Dingwell et al., 2010). As an example of this data, the stride
time, length, velocity, and position of the first trial of subject 13 are shown
in Fig. 4.
2.4 Adding uncertainty to the model
To model uncertainty and the subject’s variabilities, we added random
noises to the four control system models as shown in Eqs. (19), (20).
ð
Impulse n +1Þ ¼ Impulse nðÞ + C_pu_LðnÞ + C_pu_VðnÞ
+ C_pu_PðnÞ + η rand (19)
kn +1Þ ¼ knðÞ + C_k_TnðÞ + C_k_VnðÞ + C_k_PnðÞ + γ rand (20)
ð
1.13
1.34
1.12
1.11 1.32
1.1 1.30
Stride time 1.09 Stride length 1.28
1.08
1.07
1.26
1.06
1.05 1.24
1.04
50 100 150 200 250 50 100 150 200 250
(A) Stride number (B) Stride number
0.15
1.36
0.1
1.34
0.05
1.32 0
Stride velocity 1.30 Stride position –0.05
1.28 –0.01
–0.15
1.26
–0.2
1.24
50 100 150 200 250 50 100 150 200 250
(C) Stride number (D) Stride number
Fig. 4 An example of time series about walking on the treadmill. (A), (B), (C), and
(D) represent stride length, duration time, velocity, and position, respectively.