
Page 303 - Control Theory in Biomedical Engineering
P. 303
276 Control theory in biomedical engineering
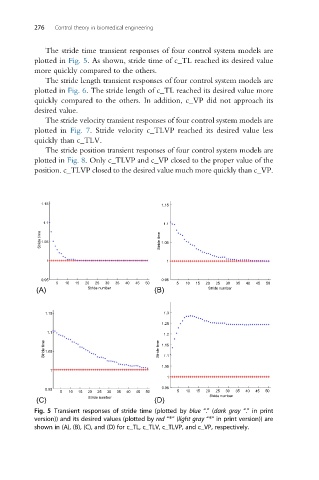
The stride time transient responses of four control system models are
plotted in Fig. 5. As shown, stride time of c_TL reached its desired value
more quickly compared to the others.
The stride length transient responses of four control system models are
plotted in Fig. 6. The stride length of c_TL reached its desired value more
quickly compared to the others. In addition, c_VP did not approach its
desired value.
The stride velocity transient responses of four control system models are
plotted in Fig. 7. Stride velocity c_TLVP reached its desired value less
quickly than c_TLV.
The stride position transient responses of four control system models are
plotted in Fig. 8. Only c_TLVP and c_VP closed to the proper value of the
position. c_TLVP closed to the desired value much more quickly than c_VP.
1.15 1.15
1.1 1.1
Stride time 1.05 Stride time 1.05
1 1
0.95 0.95
5 10 15 20 25 30 35 40 45 50 5 10 15 20 25 30 35 40 45 50
(A) Stride number (B) Stride number
1.15 1.3
1.25
1.1
1.2
Stride time 1.05 Stride time 1.15
1.1
1.05
1
1
0.95
0.95
5 10 15 20 25 30 35 40 45 50 5 10 15 20 25 30 35 40 45 50
Stride number
Stride number
(C) (D)
Fig. 5 Transient responses of stride time (plotted by blue “.” (dark gray “.” in print
version)) and its desired values (plotted by red “*” (light gray “*” in print version)) are
shown in (A), (B), (C), and (D) for c_TL, c_TLV, c_TLVP, and c_VP, respectively.