
Page 305 - Control Theory in Biomedical Engineering
P. 305
278 Control theory in biomedical engineering
1.4
3.5
1.2
3
2.5 1
Stride position 1.5 2 Stride position 0.8
0.6
1
0.4
0.5
0.2
0
0
–0.5
5 10 15 20 25 30 35 40 45 50 5 10 15 20 25 30 35 40 45 50
(A) Stride number (B) Stride number
0.6
0.25
0.5 0.2
0.15
0.4 0.1
Stride position 0.3 Stride position 0.05 0
0.2
–0.05
0.1
–0.1
0
–0.15
–0.1 –0.2
5 10 15 20 25 30 35 40 45 50 5 10 15 20 25 30 35 40 45 50
(C) Stride number (D) Stride number
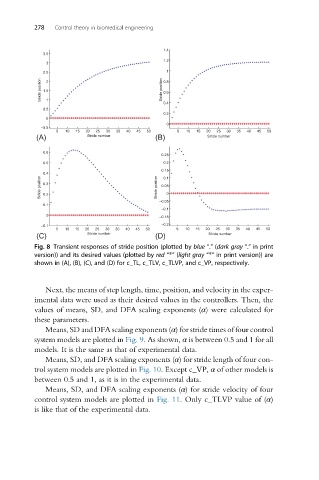
Fig. 8 Transient responses of stride position (plotted by blue “.” (dark gray “.” in print
version)) and its desired values (plotted by red “*” (light gray “*” in print version)) are
shown in (A), (B), (C), and (D) for c_TL, c_TLV, c_TLVP, and c_VP, respectively.
Next, the means of step length, time, position, and velocity in the exper-
imental data were used as their desired values in the controllers. Then, the
values of means, SD, and DFA scaling exponents (α) were calculated for
these parameters.
Means, SD and DFA scaling exponents (α) for stride times of four control
system models are plotted in Fig. 9. As shown, α is between 0.5 and 1 for all
models. It is the same as that of experimental data.
Means, SD, and DFA scaling exponents (α) for stride length of four con-
trol system models are plotted in Fig. 10. Except c_VP, α of other models is
between 0.5 and 1, as it is in the experimental data.
Means, SD, and DFA scaling exponents (α) for stride velocity of four
control system models are plotted in Fig. 11. Only c_TLVP value of (α)
is like that of the experimental data.