
Page 377 - Control Theory in Biomedical Engineering
P. 377
Tunable stiffness using negative Poisson's ratio 343
y F
Tension
x
Compression
(A)
s max
C dA
s x
y
Neutral surface
(B)
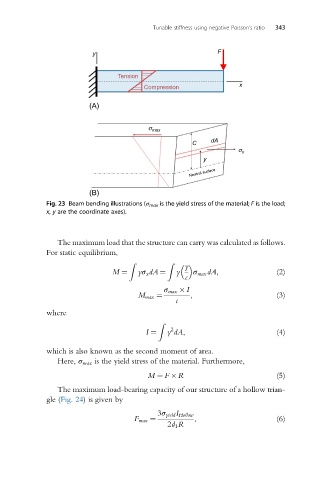
Fig. 23 Beam bending illustrations (σ max is the yield stress of the material; F is the load;
x, y are the coordinate axes).
The maximum load that the structure can carry was calculated as follows.
For static equilibrium,
Z Z
y
M ¼ yσ x dA ¼ y σ max dA, (2)
c
σ max I
M max ¼ , (3)
c
where
Z
2
I ¼ y dA, (4)
which is also known as the second moment of area.
Here, σ max is the yield stress of the material. Furthermore,
M ¼ F R (5)
The maximum load-bearing capacity of our structure of a hollow trian-
gle (Fig. 24) is given by
3σ yield I Hollow
F max ¼ , (6)
2d 1 R