
Page 60 - Control Theory in Biomedical Engineering
P. 60
Mathematical modeling of cholesterol homeostasis 47
related to the oxidized form of LDL (oxyC). This oxidized cholesterol
accumulates in macrophages (route 9), gradually transforming them into
foam cells, which in turn leads to the development of atherosclerotic
lesions.
5. An important part of the balanced transport of cholesterol is its reverse
transport. This transport is carried out by the APOA1 protein, which
is synthesized in the liver (route 10). With the help of macrophages,
which have ABCA1 transport protein, APOA1 is enriched with choles-
terol molecules that are mainly derived from dead cells during the process
of apoptosis. Initially, the pre-β1 HDL aggregates are formed with a low-
cholesterol content, which are gradually transformed into forms such as
pre-β2 HDL, HDL3, and HDL2 following enrichment with cholesterol
(routes 11–16). The last form is recognized by specific receptors in the
liver (route 17) (Daniels et al., 2009).
6. Another important factor involved in cholesterol homeostasis is the cho-
lesteryl ester transfer protein (CETP). This protein allows the exchange
of cholesterol ester between lipoproteins (e.g., between HDL and LDL)
(route 18) (Daniels et al., 2009).
3 Two-compartment model of cholesterol homeostasis
The current state of knowledge on cholesterol homeostasis, schematically
shown in Fig. 1, can be summarized using a simplified mathematical model
containing only two compartments: blood flowing through the liver (first
compartment) and peripheral blood (second compartment) (Fig. 2).
m , V (6, 7, 9) k ∗ m 1 m , V
12
1 1 2 2
k ∗m (10–17) Peripheral
2
12
Liver blood
k
m 1
(5) m diet m tis
(1) (8)
m m
in out
(2, 4) (3)
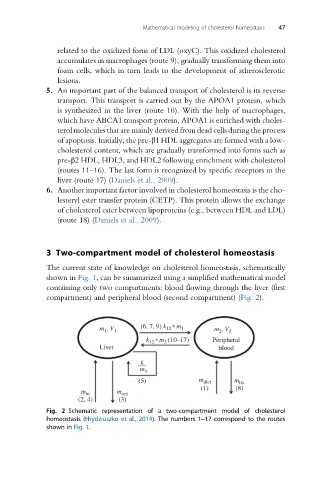
Fig. 2 Schematic representation of a two-compartment model of cholesterol
homeostasis (Hrydziuszko et al., 2014). The numbers 1–17 correspond to the routes
shown in Fig. 1.