
Page 35 - Corrosion Engineering Principles and Practice
P. 35
T h e S t u d y o f C o r r o s i o n 17
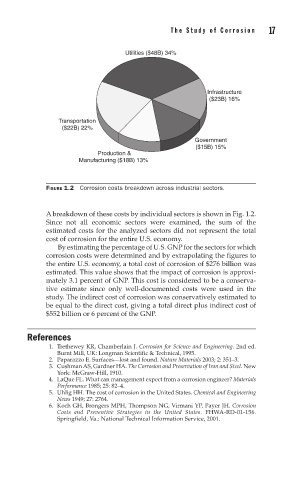
Utilities ($48B) 34%
Infrastructure
($23B) 16%
Summary of Estimated Direct Cost of Corrosion for Industry Sectors Analyzed in the 2001 Study (continued)
Transportation
($22B) 22%
Government
($15B) 15%
Production &
Manufacturing ($18B) 13%
FIGURE 1.2 Corrosion costs breakdown across industrial sectors.
A breakdown of these costs by individual sectors is shown in Fig. 1.2.
Since not all economic sectors were examined, the sum of the
estimated costs for the analyzed sectors did not represent the total
cost of corrosion for the entire U.S. economy.
By estimating the percentage of U.S. GNP for the sectors for which
corrosion costs were determined and by extrapolating the figures to
the entire U.S. economy, a total cost of corrosion of $276 billion was
estimated. This value shows that the impact of corrosion is approxi-
mately 3.1 percent of GNP. This cost is considered to be a conserva-
tive estimate since only well-documented costs were used in the
study. The indirect cost of corrosion was conservatively estimated to
be equal to the direct cost, giving a total direct plus indirect cost of
$552 billion or 6 percent of the GNP.
References
1. Trethewey KR, Chamberlain J. Corrosion for Science and Engineering. 2nd ed.
Burnt Mill, UK: Longman Scientific & Technical, 1995.
2. Paparazzo E. Surfaces—lost and found. Nature Materials 2003; 2: 351–3.
3. Cushman AS, Gardner HA. The Corrosion and Preservation of Iron and Steel. New
York: McGraw-Hill, 1910.
4. LaQue FL. What can management expect from a corrosion engineer? Materials
Performance 1985; 25: 82–4.
5. Uhlig HH. The cost of corrosion in the United States. Chemical and Engineering
News 1949; 27: 2764.
TABLE 1.2 6. Koch GH, Brongers MPH, Thompson NG, Virmani YP, Payer JH. Corrosion
Costs and Preventive Strategies in the United States. FHWA-RD-01-156.
Springfield, Va.: National Technical Information Service, 2001.
16