
Page 469 - Corrosion Engineering Principles and Practice
P. 469
436 C h a p t e r 1 1 M a t e r i a l s S e l e c t i o n , Te s t i n g , a n d D e s i g n C o n s i d e r a t i o n s 437
260
< 50 µm y –1
< 500 µm y –1
204 –1
> 500–1300 µm y <
–1
X > 1300 µm y
Temperature (°C) 149
93
38
20 40 60 80 100
Concentration (%)
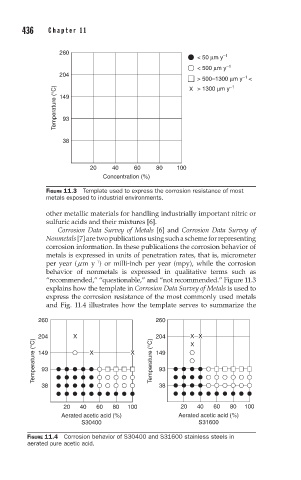
FIGURE 11.3 Template used to express the corrosion resistance of most
metals exposed to industrial environments.
other metallic materials for handling industrially important nitric or
sulfuric acids and their mixtures [6].
Corrosion Data Survey of Metals [6] and Corrosion Data Survey of
Nonmetals [7] are two publications using such a scheme for representing
corrosion information. In these publications the corrosion behavior of
metals is expressed in units of penetration rates, that is, micrometer
−1
per year ( m m y ) or milli-inch per year (mpy), while the corrosion
behavior of nonmetals is expressed in qualitative terms such as
“recommended,” “questionable,” and “not recommended.” Figure 11.3
explains how the template in Corrosion Data Survey of Metals is used to
express the corrosion resistance of the most commonly used metals
and Fig. 11.4 illustrates how the template serves to summarize the
260 X 260 X X
Temperature (°C) 204 X X Temperature (°C) 204 X
149
149
93
93
38 38
20 40 60 80 100 20 40 60 80 100
Aerated acetic acid (%) Aerated acetic acid (%)
S30400 S31600
FIGURE 11.4 Corrosion behavior of S30400 and S31600 stainless steels in
aerated pure acetic acid.