
Page 470 - Corrosion Engineering Principles and Practice
P. 470
436 C h a p t e r 1 1 M a t e r i a l s S e l e c t i o n , Te s t i n g , a n d D e s i g n C o n s i d e r a t i o n s 437
corrosion resistance of S30400 and S31600 stainless steels in aerated
acetic acid service.
11.2.3 Precision of Corrosion Data
Corrosion data are overwhelmingly empirical, often widely scattered,
and come in a variety of forms. Additionally, corrosion data from the
literature can rarely be used to predict corrosion rates in field applications.
There are many factors that explain why corrosion test results are
typically more scattered than many other types of testing, an important
one being the effect on corrosion rates due to minor impurities in the
materials themselves or in the testing environments [8].
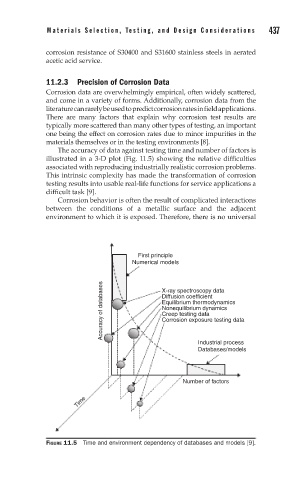
The accuracy of data against testing time and number of factors is
illustrated in a 3-D plot (Fig. 11.5) showing the relative difficulties
associated with reproducing industrially realistic corrosion problems.
This intrinsic complexity has made the transformation of corrosion
testing results into usable real-life functions for service applications a
difficult task [9].
Corrosion behavior is often the result of complicated interactions
between the conditions of a metallic surface and the adjacent
environment to which it is exposed. Therefore, there is no universal
First principle
Numerical models
Accuracy of databases X-ray spectroscopy data
Diffusion coefficient
Equilibrium thermodynamics
Nonequilibrium dynamics
Creep testing data
Corrosion exposure testing data
Industrial process
Databases/models
Number of factors
Time
FIGURE 11.5 Time and environment dependency of databases and models [9].