Page 87 - Coulson Richardson's Chemical Engineering Vol.6 Chemical Engineering Design 4th Edition
P. 87

70
                                                        CHEMICAL ENGINEERING
                                 3.7. THE EFFECT OF PRESSURE ON HEAT CAPACITY
                           The data on heat capacities given in the handbooks, and in Appendix A, are, usually for
                           the ideal gas state. Equation 3.13a should be written as:
                                                       Ž
                                                                     2
                                                     C D a C bT C cT C dT  3                     3.19
                                                       p
                           where the superscript  Ž  refers to the ideal gas state.
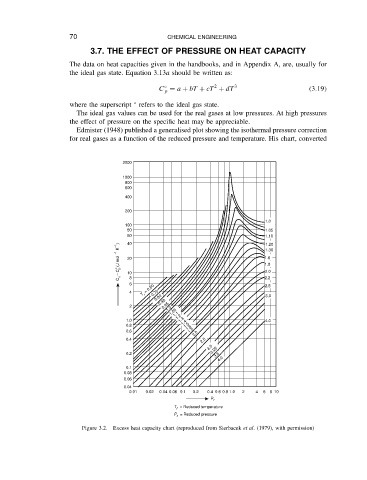
                             The ideal gas values can be used for the real gases at low pressures. At high pressures
                           the effect of pressure on the specific heat may be appreciable.
                             Edmister (1948) published a generalised plot showing the isothermal pressure correction
                           for real gases as a function of the reduced pressure and temperature. His chart, converted


                                           2000

                                           1000
                                           800
                                           600
                                           400

                                           200
                                                                                    1.0
                                           100
                                            80                                      1.05
                                            60                                      1.10
                                         −1 )  40                                   1.20
                                         −1  K  20                                  1.30
                                          C p  − C p  (J mol                        1.8
                                                                                    1.6
                                         °  10                                      2.0

                                             6 8                                    2.2
                                                T r  = 0.60
                                                                                    2.5
                                             4     0.70
                                                    0.80                            3.0
                                             2       0.90 0.95 1.0 1.05
                                            1.0           1.1 1.2 1.3 1.4           4.0
                                            0.8              1.5 1.6
                                            0.6               1.8
                                                               2.0
                                            0.4                  2.5
                                                                   3.0
                                            0.2                     3.25 3.5
                                                                      4.0
                                            0.1
                                           0.08
                                           0.06
                                           0.04
                                             0.01  0.02  0.04 0.06 0.1  0.2  0.4 0.6 0.8 1.0  2  4  6  8 10
                                                                    P r
                                                         T r   = Reduced temperature
                                                         P r   = Reduced pressure
                               Figure 3.2.  Excess heat capacity chart (reproduced from Sterbacek et al. (1979), with permission)
   82   83   84   85   86   87   88   89   90   91   92