
Page 91 - Coulson Richardson's Chemical Engineering Vol.6 Chemical Engineering Design 4th Edition
P. 91
74
CHEMICAL ENGINEERING
700
700
2800
650 650
600 600
2400
550 (588) 550
2
(981)
Dew lines (1961) kN/m
(196)
(392)
(39.2)
(98.1)
500 (9.81) 500
2000
(1.96)
450 450
400 400
1600
350 350
300 300 1200
Enthalpy, k cal/kg 250 250
200°C
200
180 200 800 Enthalpy, kJ/kg
160
150 140 150
20 kg./sq. cm.
120
100 (1961) xN/m 2 40° 100
100 (1373) Boiling lines 20° 400
80 (981) 14.0
80° 10.0 0°C
6.0
60
(588)
50 40 (196) 60° 4.0 20° 40° 50
(392)
20 (98.1) 40° 2.0 60°
1.0
Water, 0°C (49.0) 20° Liquid 0.5 80° 0
0 deg. C. (9.81) 0°C 0.2 NH 3 liquid
(19.6)
−20° 0.1 −77 °C
(1.96)
−50 −40° 0.02 Freezing line −50
Ice, −60° NH 3 solid
0 deg. C. −77 °C −400
−100 −80° −100
Freezing line
Solid Solid
−150 −150
−800
−200 −200
0 0.1 0.2 0.3 0.4 0.5 0.6 0.7 0.8 0.9 1.0
Ammonia concentration, weight fraction
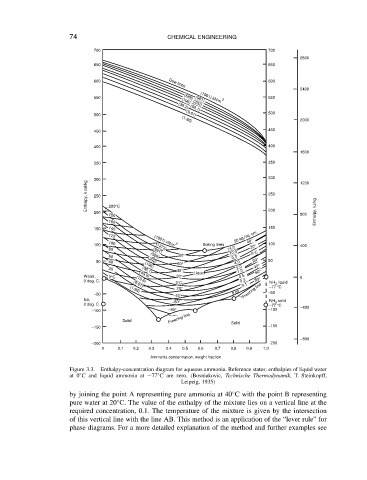
Figure 3.3. Enthalpy-concentration diagram for aqueous ammonia. Reference states: enthalpies of liquid water
at 0 ° C and liquid ammonia at 77 ° C are zero. (Bosniakovic, Technische Thermodynamik, T. Steinkopff,
Leipzig, 1935)
Ž
by joining the point A representing pure ammonia at 40 C with the point B representing
Ž
pure water at 20 C. The value of the enthalpy of the mixture lies on a vertical line at the
required concentration, 0.1. The temperature of the mixture is given by the intersection
of this vertical line with the line AB. This method is an application of the “lever rule” for
phase diagrams. For a more detailed explanation of the method and further examples see