
Page 225 - Cultural Competence in Health Education
P. 225
Aging and Health Education 203
1900 Age 1970
85
80–84
75–79
70–74
65–69
Males Females 60–64 Males Females
55–59
50–54
45–49
40–44
35–39
30–34
25–29
20–24
15–19
10–14
5–9
0–4
12 10 8 6 4 2 0 2 4 6 8 10 12 12 10 8 6 4 2 0 2 4 6 8 10 12
Percent of population Percent of population
2000 Age 2030
85
80–84
75–79
70–74
65–69
Males Females 60–64 Males Females
55–59
50–54
45–49
40–44
35–39
30–34
25–29
20–24
15–19
10–14
5–9
0–4
12 10 8 6 4 2 0 2 4 6 8 10 12 12 10 8 6 4 2 0 2 4 6 8 10 12
Percent of population Percent of population
Baby-boom generation, born between 1946 and 1964
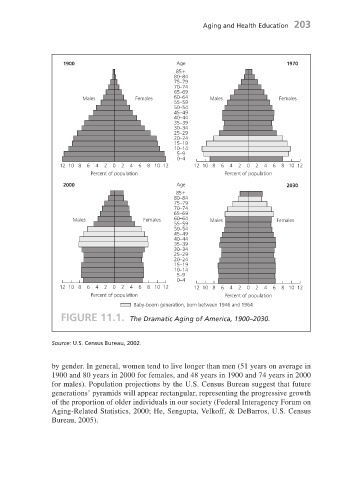
FIGURE 11.1. The Dramatic Aging of America, 1900 – 2030.
Source: U.S. Census Bureau, 2002.
by gender. In general, women tend to live longer than men (51 years on average in
1900 and 80 years in 2000 for females, and 48 years in 1900 and 74 years in 2000
for males). Population projections by the U.S. Census Bureau suggest that future
generations ’ pyramids will appear rectangular, representing the progressive growth
of the proportion of older individuals in our society (Federal Interagency Forum on
Aging - Related Statistics, 2000; He, Sengupta, Velkoff, & DeBarros, U.S. Census
Bureau, 2005).
7/1/08 3:01:50 PM
c11.indd 203 7/1/08 3:01:50 PM
c11.indd 203