
Page 226 - Cultural Competence in Health Education
P. 226
204 Cultural Competence in Health Education and Health Promotion
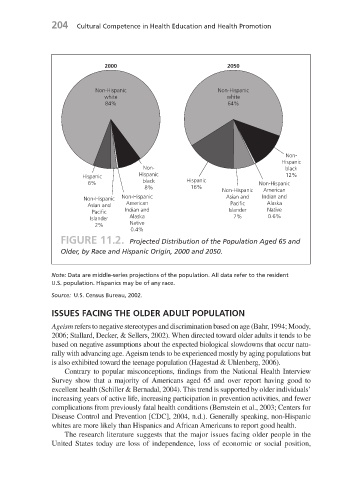
2000 2050
Non-Hispanic Non-Hispanic
white white
84% 64%
Non-
Hispanic
Non- black
Hispanic
Hispanic 12%
6% black Hispanic Non-Hispanic
8% 16%
Non-Hispanic American
Non-Hispanic Asian and Indian and
Non-Hispanic
Asian and American Pacific Alaska
Pacific Indian and Islander Native
Islander Alaska 7% 0.6%
2% Native
0.4%
FIGURE 11.2. Projected Distribution of the Population Aged 65 and
Older, by Race and Hispanic Origin, 2000 and 2050.
Note: Data are middle - series projections of the population. All data refer to the resident
U.S. population. Hispanics may be of any race.
Source: U.S. Census Bureau, 2002.
ISSUES FACING THE OLDER ADULT POPULATION
Ageism refers to negative stereotypes and discrimination based on age (Bahr, 1994; Moody,
2006; Stallard, Decker, & Sellers, 2002). When directed toward older adults it tends to be
based on negative assumptions about the expected biological slowdowns that occur natu-
rally with advancing age. Ageism tends to be experienced mostly by aging populations but
is also exhibited toward the teenage population (Hagestad & Uhlenberg, 2006).
Contrary to popular misconceptions, findings from the National Health Interview
Survey show that a majority of Americans aged 65 and over report having good to
excellent health (Schiller & Bernadal, 2004). This trend is supported by older individuals ’
increasing years of active life, increasing participation in prevention activities, and fewer
complications from previously fatal health conditions (Bernstein et al., 2003; Centers for
Disease Control and Prevention [CDC], 2004, n.d.). Generally speaking, non - Hispanic
whites are more likely than Hispanics and African Americans to report good health.
The research literature suggests that the major issues facing older people in the
United States today are loss of independence, loss of economic or social position,
7/1/08 3:01:51 PM
c11.indd 204 7/1/08 3:01:51 PM
c11.indd 204