
Page 79 - Culture Society and Economy
P. 79
Robotham-04.qxd 1/31/2005 6:23 PM Page 72
CULTURE, SOCIETY AND ECONOMY
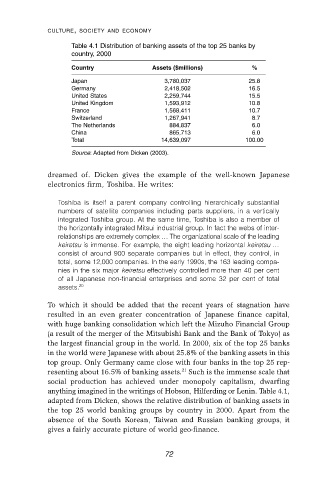
Table 4.1 Distribution of banking assets of the top 25 banks by
country, 2000
Country Assets ($millions) %
Japan 3,780,037 25.8
Germany 2,418,502 16.5
United States 2,259,744 15.5
United Kingdom 1,593,912 10.8
France 1,568,411 10.7
Switzerland 1,267,941 8.7
The Netherlands 884,837 6.0
China 865,713 6.0
Total 14,639,097 100.00
Source: Adapted from Dicken (2003).
dreamed of. Dicken gives the example of the well-known Japanese
electronics firm, Toshiba. He writes:
Toshiba is itself a parent company controlling hierarchically substantial
numbers of satellite companies including parts suppliers, in a vertically
integrated Toshiba group. At the same time, Toshiba is also a member of
the horizontally integrated Mitsui industrial group. In fact the webs of inter-
relationships are extremely complex … The organizational scale of the leading
keiretsu is immense. For example, the eight leading horizontal keiretsu …
consist of around 900 separate companies but in effect, they control, in
total, some 12,000 companies. In the early 1990s, the 163 leading compa-
nies in the six major keiretsu effectively controlled more than 40 per cent
of all Japanese non-financial enterprises and some 32 per cent of total
assets. 20
To which it should be added that the recent years of stagnation have
resulted in an even greater concentration of Japanese finance capital,
with huge banking consolidation which left the Mizuho Financial Group
(a result of the merger of the Mitsubishi Bank and the Bank of Tokyo) as
the largest financial group in the world. In 2000, six of the top 25 banks
in the world were Japanese with about 25.8% of the banking assets in this
top group. Only Germany came close with four banks in the top 25 rep-
21
resenting about 16.5% of banking assets. Such is the immense scale that
social production has achieved under monopoly capitalism, dwarfing
anything imagined in the writings of Hobson, Hilferding or Lenin. Table 4.1,
adapted from Dicken, shows the relative distribution of banking assets in
the top 25 world banking groups by country in 2000. Apart from the
absence of the South Korean, Taiwan and Russian banking groups, it
gives a fairly accurate picture of world geo-finance.
72