Page 670 - Discrete Mathematics and Its Applications
P. 670

10.1 Graphs and Graph Models  649


                                                                                     Game winners shown in blue
                                                             Stanford                                                  Connecticut
                                                             Georgia                                                    Iowa State
                                                                       Stanford                              Connecticut
                                       Team   Team
                                                                       Xavier                                Florida State
                                        1      2
                                                             Xavier                                                    Florida State
                                                             Gonzaga             Stanford   Connecticut  Connecticut  Mississippi State
                                                                                 Oklahoma  Stanford    Baylor
                                 Team              Team      Oklahoma                                                      Baylor
                                   6                3
                                                             Notre Dame                                                 Tennessee
                                                                       Oklahoma                                  Baylor
                                                                       Kentucky                                   Duke
                                       Team   Team           Kentucky                                                       Duke
                                        5      4             Nebraska                                                San Diego State

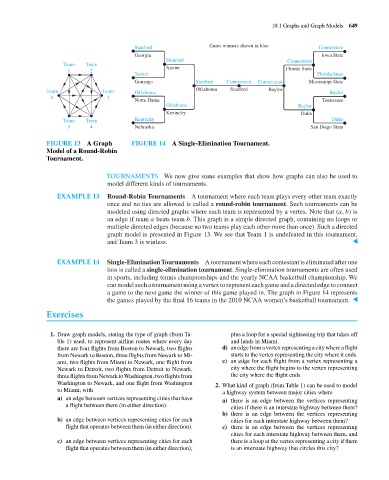
                                 FIGURE 13 A Graph          FIGURE 14 A Single-Elimination Tournament.
                                 Model of a Round-Robin
                                 Tournament.

                                                    TOURNAMENTS We now give some examples that show how graphs can also be used to
                                                     model different kinds of tournaments.
                                     EXAMPLE 13      Round-Robin Tournaments A tournament where each team plays every other team exactly
                                                     once and no ties are allowed is called a round-robin tournament. Such tournaments can be
                                                     modeled using directed graphs where each team is represented by a vertex. Note that (a, b) is
                                                     an edge if team a beats team b. This graph is a simple directed graph, containing no loops or
                                                     multiple directed edges (because no two teams play each other more than once). Such a directed
                                                     graph model is presented in Figure 13. We see that Team 1 is undefeated in this tournament,
                                                     and Team 3 is winless.                                                         ▲


                                     EXAMPLE 14      Single-EliminationTournaments A tournament where each contestant is eliminated after one
                                                     loss is called a single-elimination tournament. Single-elimination tournaments are often used
                                                     in sports, including tennis championships and the yearly NCAA basketball championship. We
                                                     can model such a tournament using a vertex to represent each game and a directed edge to connect
                                                     a game to the next game the winner of this game played in. The graph in Figure 14 represents
                                                     the games played by the final 16 teams in the 2010 NCAA women’s basketball tournament.  ▲
                                 Exercises


                                   1. Draw graph models, stating the type of graph (from Ta-  plus a loop for a special sightseeing trip that takes off
                                     ble 1) used, to represent airline routes where every day  and lands in Miami.
                                     there are four flights from Boston to Newark, two flights  d) an edge from a vertex representing a city where a flight
                                     from Newark to Boston, three flights from Newark to Mi-  starts to the vertex representing the city where it ends.
                                     ami, two flights from Miami to Newark, one flight from  e) an edge for each flight from a vertex representing a
                                     Newark to Detroit, two flights from Detroit to Newark,  city where the flight begins to the vertex representing
                                     three flights from Newark toWashington, two flights from  the city where the flight ends.
                                     Washington to Newark, and one flight from Washington
                                                                                       2. What kind of graph (from Table 1) can be used to model
                                     to Miami, with
                                                                                         a highway system between major cities where
                                     a) an edge between vertices representing cities that have
                                                                                         a) there is an edge between the vertices representing
                                        a flight between them (in either direction).
                                                                                            cities if there is an interstate highway between them?
                                                                                         b) there is an edge between the vertices representing
                                     b) an edge between vertices representing cities for each  cities for each interstate highway between them?
                                        flight that operates between them (in either direction).  c) there is an edge between the vertices representing
                                                                                            cities for each interstate highway between them, and
                                     c) an edge between vertices representing cities for each  there is a loop at the vertex representing a city if there
                                        flight that operates between them (in either direction),  is an interstate highway that circles this city?
   665   666   667   668   669   670   671   672   673   674   675