
Page 666 - Discrete Mathematics and Its Applications
P. 666
10.1 Graphs and Graph Models 645
Eduardo
Jan Paula Todd Kamlesh
Amy
Kamini Ching
Linda Brian
Lila
Steve
Liz
Joel
Gail
Koko
Kari Shaquira Deborah Fred Yvonne
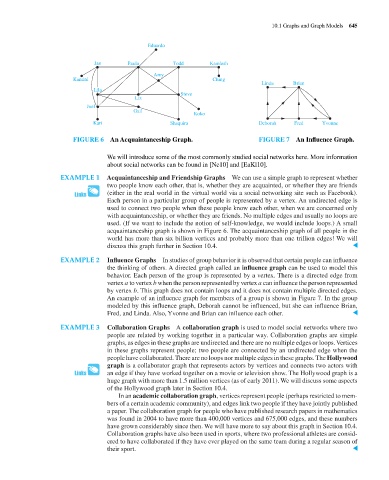
FIGURE 6 An Acquaintanceship Graph. FIGURE 7 An Influence Graph.
We will introduce some of the most commonly studied social networks here. More information
about social networks can be found in [Ne10] and [EaKl10].
EXAMPLE 1 Acquaintanceship and Friendship Graphs We can use a simple graph to represent whether
two people know each other, that is, whether they are acquainted, or whether they are friends
(either in the real world in the virtual world via a social networking site such as Facebook).
Each person in a particular group of people is represented by a vertex. An undirected edge is
used to connect two people when these people know each other, when we are concerned only
with acquaintanceship, or whether they are friends. No multiple edges and usually no loops are
used. (If we want to include the notion of self-knowledge, we would include loops.) A small
acquaintanceship graph is shown in Figure 6. The acquaintanceship graph of all people in the
world has more than six billion vertices and probably more than one trillion edges! We will
discuss this graph further in Section 10.4. ▲
EXAMPLE 2 Influence Graphs In studies of group behavior it is observed that certain people can influence
the thinking of others. A directed graph called an influence graph can be used to model this
behavior. Each person of the group is represented by a vertex. There is a directed edge from
vertex a to vertex b when the person represented by vertex a can influence the person represented
by vertex b. This graph does not contain loops and it does not contain multiple directed edges.
An example of an influence graph for members of a group is shown in Figure 7. In the group
modeled by this influence graph, Deborah cannot be influenced, but she can influence Brian,
Fred, and Linda. Also, Yvonne and Brian can influence each other. ▲
EXAMPLE 3 Collaboration Graphs A collaboration graph is used to model social networks where two
people are related by working together in a particular way. Collaboration graphs are simple
graphs, as edges in these graphs are undirected and there are no multiple edges or loops.Vertices
in these graphs represent people; two people are connected by an undirected edge when the
people have collaborated. There are no loops nor multiple edges in these graphs. The Hollywood
graph is a collaborator graph that represents actors by vertices and connects two actors with
an edge if they have worked together on a movie or television show. The Hollywood graph is a
huge graph with more than 1.5 million vertices (as of early 2011). We will discuss some aspects
of the Hollywood graph later in Section 10.4.
In an academic collaboration graph, vertices represent people (perhaps restricted to mem-
bers of a certain academic community), and edges link two people if they have jointly published
a paper. The collaboration graph for people who have published research papers in mathematics
was found in 2004 to have more than 400,000 vertices and 675,000 edges, and these numbers
have grown considerably since then. We will have more to say about this graph in Section 10.4.
Collaboration graphs have also been used in sports, where two professional athletes are consid-
ered to have collaborated if they have ever played on the same team during a regular season of
their sport. ▲