
Page 669 - Discrete Mathematics and Its Applications
P. 669
648 10 / Graphs
one-way roads. Multiple undirected edges represent multiple two-way roads connecting the
same two intersections. Multiple directed edges represent multiple one-way roads that start at
one intersection and end at a second intersection. Loops represent loop roads. Mixed graphs are
needed to model road networks that include both one-way and two-way roads. ▲
BIOLOGICAL NETWORKS Many aspects of the biological sciences can be modeled using
graphs.
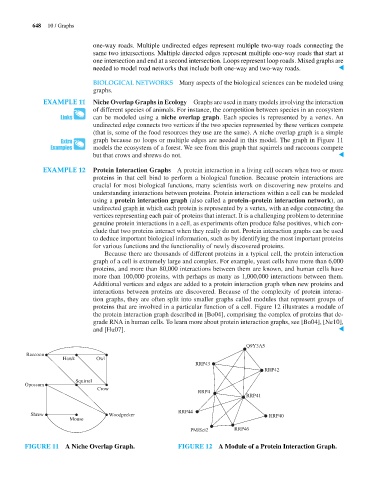
EXAMPLE 11 Niche Overlap Graphs in Ecology Graphs are used in many models involving the interaction
of different species of animals. For instance, the competition between species in an ecosystem
can be modeled using a niche overlap graph. Each species is represented by a vertex. An
undirected edge connects two vertices if the two species represented by these vertices compete
(that is, some of the food resources they use are the same). A niche overlap graph is a simple
graph because no loops or multiple edges are needed in this model. The graph in Figure 11
models the ecosystem of a forest. We see from this graph that squirrels and raccoons compete
but that crows and shrews do not. ▲
EXAMPLE 12 Protein Interaction Graphs A protein interaction in a living cell occurs when two or more
proteins in that cell bind to perform a biological function. Because protein interactions are
crucial for most biological functions, many scientists work on discovering new proteins and
understanding interactions between proteins. Protein interactions within a cell can be modeled
using a protein interaction graph (also called a protein–protein interaction network), an
undirected graph in which each protein is represented by a vertex, with an edge connecting the
vertices representing each pair of proteins that interact. It is a challenging problem to determine
genuine protein interactions in a cell, as experiments often produce false positives, which con-
clude that two proteins interact when they really do not. Protein interaction graphs can be used
to deduce important biological information, such as by identifying the most important proteins
for various functions and the functionality of newly discovered proteins.
Because there are thousands of different proteins in a typical cell, the protein interaction
graph of a cell is extremely large and complex. For example, yeast cells have more than 6,000
proteins, and more than 80,000 interactions between them are known, and human cells have
more than 100,000 proteins, with perhaps as many as 1,000,000 interactions between them.
Additional vertices and edges are added to a protein interaction graph when new proteins and
interactions between proteins are discovered. Because of the complexity of protein interac-
tion graphs, they are often split into smaller graphs called modules that represent groups of
proteins that are involved in a particular function of a cell. Figure 12 illustrates a module of
the protein interaction graph described in [Bo04], comprising the complex of proteins that de-
grade RNA in human cells. To learn more about protein interaction graphs, see [Bo04], [Ne10],
and [Hu07]. ▲
Q9Y3A5
Raccoon
Hawk Owl
RRP43
RRP42
Squirrel
Opossum
Crow
RRP4
RRP41
RRP44
Shrew Woodpecker RRP40
Mouse
PM/Sci2 RRP46
FIGURE 11 A Niche Overlap Graph. FIGURE 12 A Module of a Protein Interaction Graph.