Page 175 -
P. 175

11-ch04-125-186-9780123814791
                                                            2011/6/1
                         HAN
          138   Chapter 4 Data Warehousing and Online Analytical Processing  3:17 Page 138  #14


                          location (cities)  Chicago  854  882  89  623

                                 New York
                              Toronto  818  1087  968 43  38 591  872
                                            746
                         Vancouver                               698
                                                             925
                              Q1  605  825   14  400     682  1002  789
                           time (quarters)  Q2  680  1023  31  512  728  984  870
                                       952
                              Q3
                                                 501
                                  812
                                             30
                                                          784
                              Q4  927  1038  38  580
                                     computer   security
                                 home      phone
                               entertainment
                                       item (types)

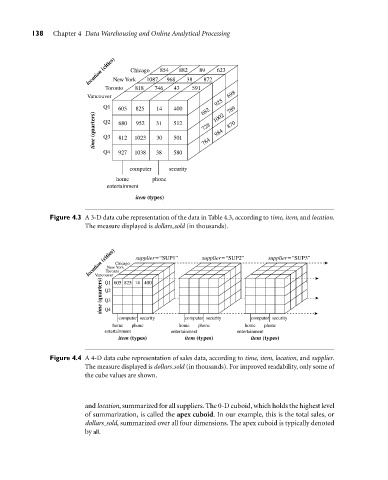
               Figure 4.3 A 3-D data cube representation of the data in Table 4.3, according to time, item, and location.
                         The measure displayed is dollars sold (in thousands).


                          location (cities)  Chicago  supplier = “SUP1”  supplier =“SUP2”  supplier=“SUP3”

                               New York
                              Toronto
                           Vancouver
                             time (quarters)  Q1  605 825 14 400
                              Q2
                              Q3
                              Q4
                                  computer security  computer security  computer security
                                home  phone        home  phone       home  phone
                              entertainment      entertainment     entertainment
                                  item (types)      item (types)       item (types)


               Figure 4.4 A 4-D data cube representation of sales data, according to time, item, location, and supplier.
                         The measure displayed is dollars sold (in thousands). For improved readability, only some of
                         the cube values are shown.


                         and location, summarized for all suppliers. The 0-D cuboid, which holds the highest level
                         of summarization, is called the apex cuboid. In our example, this is the total sales, or
                         dollars sold, summarized over all four dimensions. The apex cuboid is typically denoted
                         by all.
   170   171   172   173   174   175   176   177   178   179   180