
Page 84 -
P. 84
HAN
2011/6/1
09-ch02-039-082-9780123814791
3:15 Page 47
#9
2.2 Basic Statistical Descriptions of Data 47
lower than the median interval, freq median is the frequency of the median interval, and
width is the width of the median interval.
The mode is another measure of central tendency. The mode for a set of data is the
value that occurs most frequently in the set. Therefore, it can be determined for qualita-
tive and quantitative attributes. It is possible for the greatest frequency to correspond to
several different values, which results in more than one mode. Data sets with one, two,
or three modes are respectively called unimodal, bimodal, and trimodal. In general, a
data set with two or more modes is multimodal. At the other extreme, if each data value
occurs only once, then there is no mode.
Example 2.8 Mode. The data from Example 2.6 are bimodal. The two modes are $52,000 and
$70,000.
For unimodal numeric data that are moderately skewed (asymmetrical), we have the
following empirical relation:
mean − mode ≈ 3 × (mean − median). (2.4)
This implies that the mode for unimodal frequency curves that are moderately skewed
can easily be approximated if the mean and median values are known.
The midrange can also be used to assess the central tendency of a numeric data set.
It is the average of the largest and smallest values in the set. This measure is easy to
compute using the SQL aggregate functions, max() and min().
Example 2.9 Midrange. The midrange of the data of Example 2.6 is 30,000+110,000 = $70,000.
2
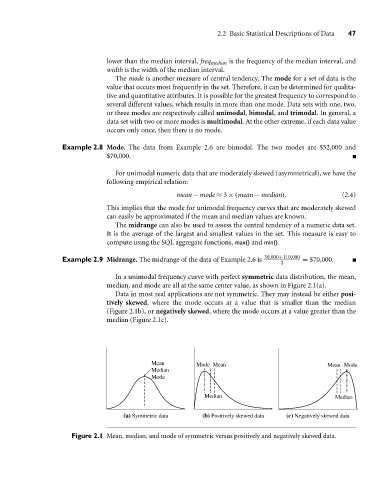
In a unimodal frequency curve with perfect symmetric data distribution, the mean,
median, and mode are all at the same center value, as shown in Figure 2.1(a).
Data in most real applications are not symmetric. They may instead be either posi-
tively skewed, where the mode occurs at a value that is smaller than the median
(Figure 2.1b), or negatively skewed, where the mode occurs at a value greater than the
median (Figure 2.1c).
Mean Mode Mean Mean Mode
Median
Mode
Median Median
(a) Symmetric data (b) Positively skewed data (c) Negatively skewed data
Figure 2.1 Mean, median, and mode of symmetric versus positively and negatively skewed data.