
Page 85 -
P. 85
HAN 09-ch02-039-082-9780123814791
48 Chapter 2 Getting to Know Your Data 2011/6/1 3:15 Page 48 #10
2.2.2 Measuring the Dispersion of Data: Range, Quartiles, Variance,
Standard Deviation, and Interquartile Range
We now look at measures to assess the dispersion or spread of numeric data. The mea-
sures include range, quantiles, quartiles, percentiles, and the interquartile range. The
five-number summary, which can be displayed as a boxplot, is useful in identifying
outliers. Variance and standard deviation also indicate the spread of a data distribution.
Range, Quartiles, and Interquartile Range
To start off, let’s study the range, quantiles, quartiles, percentiles, and the interquartile
range as measures of data dispersion.
Let x 1 ,x 2 ,...,x N be a set of observations for some numeric attribute, X. The range
of the set is the difference between the largest (max()) and smallest (min()) values.
Suppose that the data for attribute X are sorted in increasing numeric order. Imagine
that we can pick certain data points so as to split the data distribution into equal-size
consecutive sets, as in Figure 2.2. These data points are called quantiles. Quantiles are
points taken at regular intervals of a data distribution, dividing it into essentially equal-
size consecutive sets. (We say “essentially” because there may not be data values of X that
divide the data into exactly equal-sized subsets. For readability, we will refer to them as
equal.) The kth q-quantile for a given data distribution is the value x such that at most
k/q of the data values are less than x and at most (q − k)/q of the data values are more
than x, where k is an integer such that 0 < k < q. There are q − 1 q-quantiles.
The 2-quantile is the data point dividing the lower and upper halves of the data dis-
tribution. It corresponds to the median. The 4-quantiles are the three data points that
split the data distribution into four equal parts; each part represents one-fourth of the
data distribution. They are more commonly referred to as quartiles. The 100-quantiles
are more commonly referred to as percentiles; they divide the data distribution into 100
equal-sized consecutive sets. The median, quartiles, and percentiles are the most widely
used forms of quantiles.
25%
Q 1 Q 2 Q 3
25th Median 75th
percentile percentile
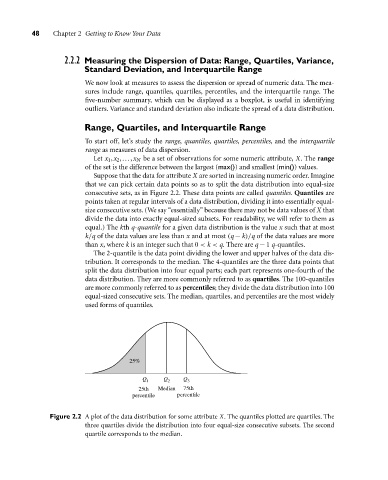
Figure 2.2 A plot of the data distribution for some attribute X. The quantiles plotted are quartiles. The
three quartiles divide the distribution into four equal-size consecutive subsets. The second
quartile corresponds to the median.