
Page 93 -
P. 93
72 CHAPTER 7 Assess
Activity Summary Table
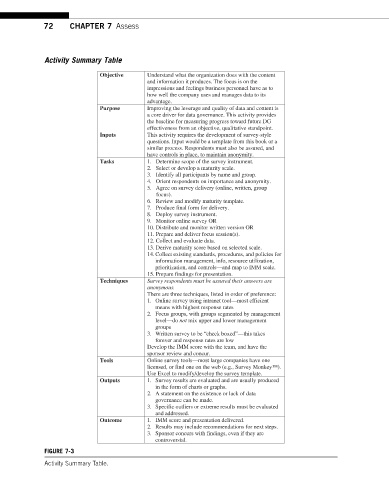
Objective Understand what the organization does with the content
and information it produces. The focus is on the
impressions and feelings business personnel have as to
how well the company uses and manages data to its
advantage.
Purpose Improving the leverage and quality of data and content is
a core driver for data governance. This activity provides
the baseline for measuring progress toward future DG
effectiveness from an objective, qualitative standpoint.
Inputs This activity requires the development of survey-style
questions. Input would be a template from this book or a
similar process. Respondents must also be assured, and
have controls in place, to maintain anonymity.
Tasks 1. Determine scope of the survey instrument.
2. Select or develop a maturity scale.
3. Identify all participants by name and group.
4. Orient respondents on importance and anonymity.
5. Agree on survey delivery (online, written, group
focus).
6. Review and modify maturity template.
7. Produce final form for delivery.
8. Deploy survey instrument.
9. Monitor online survey OR
10. Distribute and monitor written version OR
11. Prepare and deliver focus session(s).
12. Collect and evaluate data.
13. Derive maturity score based on selected scale.
14. Collect existing standards, procedures, and policies for
information management, info, resource utilization,
prioritization, and controls—and map to IMM scale.
15. Prepare findings for presentation.
Techniques Survey respondents must be assured their answers are
anonymous.
There are three techniques, listed in order of preference:
1. Online survey using intranet tool—most efficient
means with highest response rates
2. Focus groups, with groups segmented by management
level—do not mix upper and lower management
groups
3. Written survey to be “check boxed”—this takes
forever and response rates are low
Develop the IMM score with the team, and have the
sponsor review and concur.
Tools Online survey tools—most large companies have one
licensed, or find one on the web (e.g., Survey Monkey™).
Use Excel to modify/develop the survey template.
Outputs 1. Survey results are evaluated and are usually produced
in the form of charts or graphs.
2. A statement on the existence or lack of data
governance can be made.
3. Specific outliers or extreme results must be evaluated
and addressed.
Outcome 1. IMM score and presentation delivered.
2. Results may include recommendations for next steps.
3. Sponsor concurs with findings, even if they are
controversial.
FIGURE 7-3
Activity Summary Table.