
Page 98 -
P. 98
Overview 77
Business Benefits and Ramifications
The data collected from this step will be used throughout the program design and for a long time after
the rollout. It provides an excellent baseline to measure EIM adoption as well.
Approach Considerations
This is a strongly recommended effort. There really is no optional pathdit has to be done. It can be done
in two passes: a brief informal iteration now and then a detailed formal pass during the Road Map or
Sustaining phases. The most common approach is to do a survey that is geared to reveal any glaring issues
now, afterward revisiting the change capacity assessment during the Road Map and Sustaining phases.
Some organizations will resist any assessment of culture from any sort of “technical” team. If the
DG team cannot overcome this obstacle, bury the most telling aspects of the change-capacity
instrument in the IMM survey.
The target audience is all management, as well as knowledge workers or departmental analysts.
The population to be surveyed needs to be segregated, with results kept by whatever segments you
choose. At a minimum, segregate upper management, middle management, and all others.
This assessment is in the form of a survey and is best done online. If an online survey option is not
available, switch to focus groups. Given historically low response rates, the last resort is a form to be
filled out. If the focus group or paper form options are used, allow several weeks to get focus groups
scheduled. Then, allow two weeks for forms to come back, but expect three weeks during which they
actually keep showing up.
If there is a hint of sweeping changes, or known resistance areas are already identified (i.e., a prior
attempt at information management failed in some way due to resistance), then a formal instrument is
strongly recommended.
Sample Output
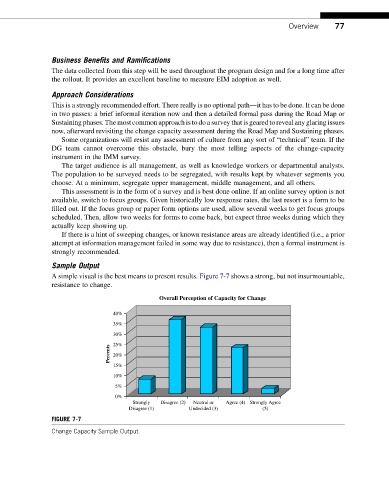
A simple visual is the best means to present results. Figure 7-7 shows a strong, but not insurmountable,
resistance to change.
Overall Perception of Capacity for Change
40%
35%
30%
25%
Percents 20%
15%
10%
5%
0%
Strongly Disagree (2) Neutral or Agree (4) Strongly Agree
Disagree (1) Undecided (3) (5)
FIGURE 7-7
Change Capacity Sample Output.