
Page 117 - Decision Making Applications in Modern Power Systems
P. 117
Uncertainty analysis and risk assessment Chapter | 3 83
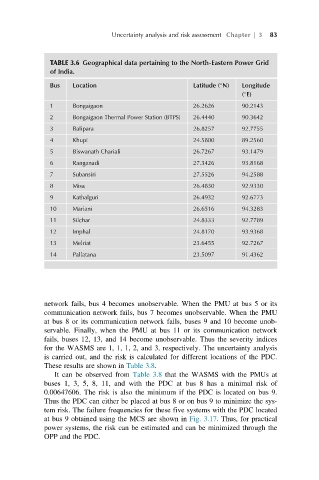
TABLE 3.6 Geographical data pertaining to the North-Eastern Power Grid
of India.
Bus Location Latitude ( N) Longitude
( E)
1 Bongaigaon 26.2626 90.2143
2 Bongaigaon Thermal Power Station (BTPS) 26.4440 90.3642
3 Balipara 26.8257 92.7755
4 Khupi 24.5800 89.2560
5 Biswanath Chariali 26.7267 93.1479
6 Ranganadi 27.3426 93.8168
7 Subansiri 27.5526 94.2588
8 Misa 26.4830 92.9330
9 Kathalguri 26.4932 92.6773
10 Mariani 26.6516 94.3283
11 Silchar 24.8333 92.7789
12 Imphal 24.8170 93.9368
13 Melriat 23.6455 92.7267
14 Pallatana 23.5097 91.4362
network fails, bus 4 becomes unobservable. When the PMU at bus 5 or its
communication network fails, bus 7 becomes unobservable. When the PMU
at bus 8 or its communication network fails, buses 9 and 10 become unob-
servable. Finally, when the PMU at bus 11 or its communication network
fails, buses 12, 13, and 14 become unobservable. Thus the severity indices
for the WASMS are 1, 1, 1, 2, and 3, respectively. The uncertainty analysis
is carried out, and the risk is calculated for different locations of the PDC.
These results are shown in Table 3.8.
It can be observed from Table 3.8 that the WASMS with the PMUs at
buses 1, 3, 5, 8, 11, and with the PDC at bus 8 has a minimal risk of
0.00647606. The risk is also the minimum if the PDC is located on bus 9.
Thus the PDC can either be placed at bus 8 or on bus 9 to minimize the sys-
tem risk. The failure frequencies for these five systems with the PDC located
at bus 9 obtained using the MCS are shown in Fig. 3.17. Thus, for practical
power systems, the risk can be estimated and can be minimized through the
OPP and the PDC.