
Page 118 - Decision Making Applications in Modern Power Systems
P. 118
84 Decision Making Applications in Modern Power Systems
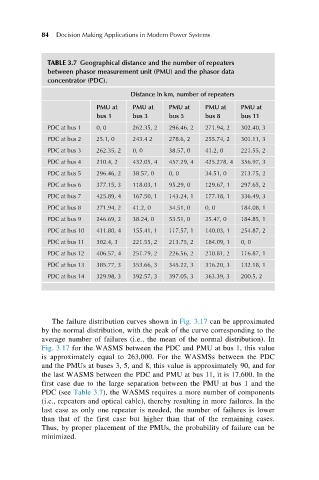
TABLE 3.7 Geographical distance and the number of repeaters
between phasor measurement unit (PMU) and the phasor data
concentrator (PDC).
Distance in km, number of repeaters
PMU at PMU at PMU at PMU at PMU at
bus 1 bus 3 bus 5 bus 8 bus 11
PDC at bus 1 0, 0 262.35, 2 296.46, 2 271.94, 2 302.40, 3
PDC at bus 2 25.1, 0 243.4 2 278.6, 2 255.74, 2 301.11, 3
PDC at bus 3 262.35, 2 0, 0 38.57, 0 41.2, 0 221.55, 2
PDC at bus 4 210.4, 2 432.05, 4 457.29, 4 425.278, 4 356.97, 3
PDC at bus 5 296.46, 2 38.57, 0 0, 0 34.51, 0 213.75, 2
PDC at bus 6 377.15, 3 118.03, 1 95.29, 0 129.67, 1 297.65, 2
PDC at bus 7 425.89, 4 167.50, 1 143.24, 1 177.18, 1 336.49, 3
PDC at bus 8 271.94, 2 41.2, 0 34.51, 0 0, 0 184.08, 1
PDC at bus 9 246.69, 2 38.24, 0 53.51, 0 25.47, 0 184.85, 1
PDC at bus 10 411.80, 4 155.41, 1 117.57, 1 140.03, 1 254.87, 2
PDC at bus 11 302.4, 3 221.55, 2 213.75, 2 184.09, 1 0, 0
PDC at bus 12 406.57, 4 251.79, 2 226.56, 2 210.81, 2 116.87, 1
PDC at bus 13 385.77, 3 353.66, 3 345.22, 3 316.20, 3 132.18, 1
PDC at bus 14 329.98, 3 392.57, 3 397.05, 3 363.39, 3 200.5, 2
The failure distribution curves shown in Fig. 3.17 can be approximated
by the normal distribution, with the peak of the curve corresponding to the
average number of failures (i.e., the mean of the normal distribution). In
Fig. 3.17 for the WASMS between the PDC and PMU at bus 1, this value
is approximately equal to 263,000. For the WASMSs between the PDC
and the PMUs at buses 3, 5, and 8, this value is approximately 90, and for
the last WASMS between the PDC and PMU at bus 11, it is 17,600. In the
first case due to the large separation between the PMU at bus 1 and the
PDC (see Table 3.7), the WASMS requires a more number of components
(i.e., repeaters and optical cable), thereby resulting in more failures. In the
last case as only one repeater is needed, the number of failures is lower
than that of the first case but higher than that of the remaining cases.
Thus, by proper placement of the PMUs, the probability of failure can be
minimized.