
Page 115 - Decision Making Applications in Modern Power Systems
P. 115
Uncertainty analysis and risk assessment Chapter | 3 81
V 2
Bus 1
Bus 2
I 12
V 4 I 14 I 13
Bus 4 V 1 V 3
PMU Bus Bus 3
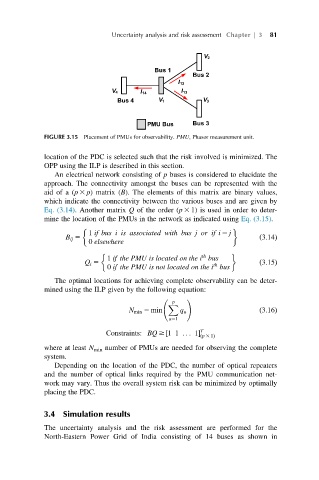
FIGURE 3.15 Placement of PMUs for observability. PMU, Phasor measurement unit.
location of the PDC is selected such that the risk involved is minimized. The
OPP using the ILP is described in this section.
An electrical network consisting of p buses is considered to elucidate the
approach. The connectivity amongst the buses can be represented with the
aid of a (p 3 p) matrix (B). The elements of this matrix are binary values,
which indicate the connectivity between the various buses and are given by
Eq. (3.14). Another matrix Q of the order (p 3 1) is used in order to deter-
mine the location of the PMUs in the network as indicated using Eq. (3.15).
1 if bus i is associated with bus j or if i 5 j
B ij 5 ð3:14Þ
0 elsewhere
th
1 if the PMU is located on the i bus
Q i 5 th ð3:15Þ
0 if the PMU is not located on the i bus
The optimal locations for achieving complete observability can be deter-
mined using the ILP given by the following equation:
p !
X
N min 5 min q u ð3:16Þ
u51
T
½
Constraints: BQ $ 11 ... 1
ðp 3 1Þ
where at least N min number of PMUs are needed for observing the complete
system.
Depending on the location of the PDC, the number of optical repeaters
and the number of optical links required by the PMU communication net-
work may vary. Thus the overall system risk can be minimized by optimally
placing the PDC.
3.4 Simulation results
The uncertainty analysis and the risk assessment are performed for the
North-Eastern Power Grid of India consisting of 14 buses as shown in